

As enterprises scale their data platforms, a critical question emerges: should you build your own data observability solution or invest in a comprehensive commercial platform? With 50% of enterprises implementing distributed data architectures expected to adopt data observability tools by 2026, up from less than 20% in 2024, this decision has moved from “nice-to-have” to business-critical.
The stakes are higher than most organizations realize. A recent analysis of a Fortune 500 consumer goods company with 200+ Databricks workspaces and $24 million in annual cloud data spend revealed that their DIY approach was costing them far more than anticipated—and missing critical optimization opportunities worth millions in potential savings.
The Gartner Framework: Why Comprehensive Coverage Matters
Gartner identifies five critical observation areas that data observability tools must address: Data content (improving data quality through completeness, uniqueness and accuracy), Data flow and pipeline (ensuring pipelines don’t experience interruption), Infrastructure and compute (ensuring sufficient resources), User, usage and utilization (understanding how data is used), and Financial allocation (reducing ecosystem costs).
The challenge? Most vendors focus on specific areas of observation rather than providing comprehensive solutions. This fragmentation forces organizations into complex multi-vendor strategies or, more commonly, into building their own solutions to fill the gaps.
Meanwhile, by 2026, a data engineering team guided by DataOps practices and tools will be 10 times more productive than teams that do not use DataOps. The productivity gap between organizations with comprehensive observability and those with fragmented approaches is widening rapidly.
The Hidden Costs of the DIY Approach
Let’s examine the real-world economics through our Fortune 500 case study. This company initially built their observability solution using popular open-source tools:
- Grafana dashboards for visualization
- Prometheus for metrics collection
- Custom Python scripts leveraging Databricks APIs
- ELK stack for log aggregation
- Tableau for cost reporting
What They Achieved
The internal team successfully created:
- Historical spend analysis and trending
- Cost allocation by organizational tags
- Resource utilization reporting
- Basic job performance metrics
What They Missed
Despite significant engineering investment, critical capabilities remained elusive:
Predictive Analytics: Their system could tell them what happened but not what would happen. With 56 million DBUs consumed annually, they discovered budget overruns after they occurred rather than preventing them.
Automated Optimization: While they could identify inefficiencies, implementing fixes required manual intervention across 3,000+ clusters. No automated right-sizing or policy enforcement existed.
Performance-Cost Correlation: Their tools captured usage and performance separately, making it nearly impossible to identify which expensive jobs could be optimized for maximum cost impact.
Intelligent Alerting: Basic threshold alerts created noise without context. They lacked ML-driven anomaly detection that could distinguish between normal usage spikes and genuine problems.
The True Cost of Building
The financial reality of internal development proved sobering:
Initial Development Investment
- 6-8 data engineers + 3-4 ML engineers + 2 DevOps engineers
- $1.8M loaded annual cost for the development team
- 12-18 months initial development timeline
- 50% ongoing maintenance effort for platform evolution
Hidden Complexity Factors
Multi-Cloud Expertise: Building sensors and APIs for unified monitoring across cloud regions required specialized Databricks knowledge that took months to acquire.
Real-Time Processing: Handling telemetry from 3,000+ clusters demanded infrastructure scaling expertise beyond their core team’s competency.
AI Model Training: Creating accurate recommendation algorithms required training data from billions of job executions—data they didn’t possess and couldn’t generate quickly.
The Three-Year Reality
- Total internal cost: $4.5M+ before any optimization savings
- Opportunity cost: Engineering talent diverted from revenue-generating analytics projects
- Platform risk: Constant need to keep pace with Databricks feature releases and cloud service changes
Unlock your data environment health with a free health check.
Commercial Solutions: The Unravel Advantage
While evaluating alternatives, the organization discovered that comprehensive commercial solutions like Unravel Data address all five Gartner observation areas with capabilities their internal team couldn’t replicate:
AI-Powered Predictive Capabilities
- Automated root cause analysis for failed jobs with contextual recommendations
- ML-based anomaly detection with pattern recognition across historical data
- Proactive notifications of potential issues before they impact users
- Cost forecasting with budget overrun predictions days in advance
Full-Spectrum Observability
- Unified coverage across all five Gartner observability dimensions
- End-to-end visibility from data ingestion through consumption
- Cross-domain correlation linking performance issues to cost impacts
- Support for complex architectures including multi-cloud deployments
Deep Platform Integration
- Native understanding of Databricks internals and architecture
- Support for Delta Lake, Photon engine, and Unity Catalog
- Integration with Databricks Workflows and Jobs
- Optimization recommendations specific to Databricks environments
ROI Analysis: The Numbers Don’t Lie
The comparison becomes clear when examining real-world results:
Documented Commercial Solution Impact
- 70% cost reduction within six months
- 20× ROI: Every $1 invested saves $20
- 75% automation time savings across engineering teams
- Proactive guardrails preventing budget overruns
Financial Comparison
For an organization with $24M annual Databricks spend:
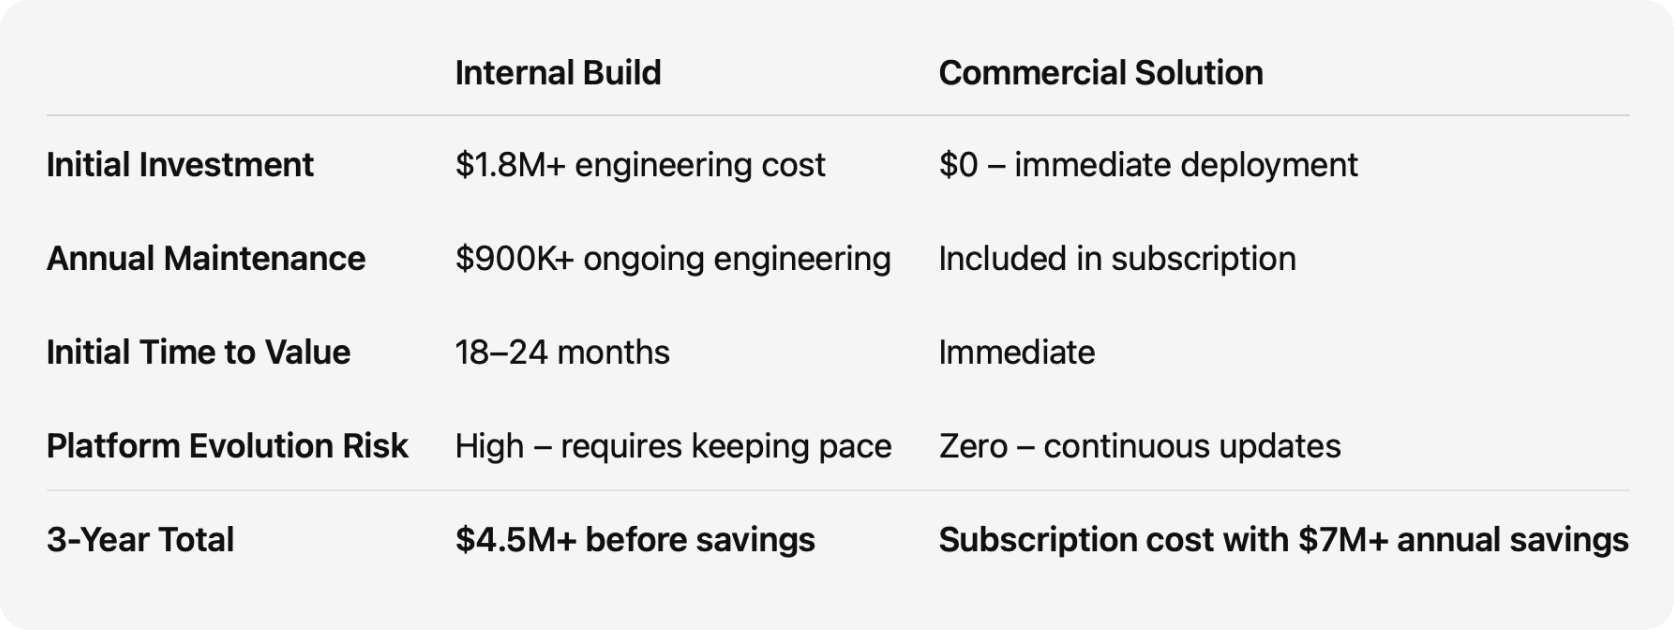
Even conservative estimates show a 30% optimization on $24M spend yields $7.2M annual savings—far exceeding any commercial solution costs while eliminating technical risk.
The Strategic Decision Framework
When evaluating build vs. buy for data observability, consider these factors:
Choose DIY When:
- You have specialized requirements no commercial solution addresses
- Large, dedicated engineering teams with surplus capacity
- Control and customization are more important than time-to-value
- Internal expertise in distributed systems and ML is readily available
Choose Commercial When:
- Time-to-value is critical for business objectives
- Engineering resources should focus on core business analytics
- Comprehensive coverage across all observability areas is required
- Proven ROI and risk mitigation are priorities
The Competitive Advantage of Comprehensive Observability
Organizations sometimes require assistance jump-starting their DataOps practice, and service providers often have their own software with DataOps capabilities requiring professional services. However, there is significant demand among data and analytics leaders to address their growing data operations complexity.
The organizations that get this right—implementing comprehensive, AI-driven observability platforms—are seeing transformational results. They’re not just reducing costs; they’re fundamentally changing how they operate their data platforms.
Making the Right Choice for Your Organization
The data observability market has matured rapidly. By 2026, 50% of enterprises implementing distributed data architectures will have adopted data observability tools to improve visibility over the state of the data landscape. The question isn’t whether you need observability—it’s whether you can afford the time, risk, and opportunity cost of building it yourself.
For most enterprises, the math is clear: comprehensive commercial solutions deliver immediate value, eliminate technical risk, and free engineering teams to focus on business-differentiating analytics. The Fortune 500 company in our case study ultimately chose this path after their analysis revealed the true cost of internal development.
As one executive put it: “We realized we were trying to solve a solved problem. Our competitive advantage isn’t in building observability platforms—it’s in using our data to drive business results.”
The build vs. buy decision for data observability has become a strategic inflection point. Organizations that choose wisely will find themselves 10× more productive, while those that don’t may find themselves debugging their way out of relevance.
Ready to evaluate your options? Consider starting with a proof-of-concept to quantify the specific savings potential for your environment before making the full build vs. buy decision.