

Table of Contents
The second part of our series “Why Your Spark Apps Are Slow or Failing” follows Part I on memory management and deals with issues that arise with data skew and garbage collection in Spark. Like many performance challenges with Spark, the symptoms increase as the scale of data handled by the application increases.
What is Data Skew?
In an ideal Spark application run, when Spark wants to perform a join, for example, join keys would be evenly distributed and each partition would get nicely organized to process. However, real business data is rarely so neat and cooperative. We often end up with less than ideal data organization across the Spark cluster that results in degraded performance due to data skew.
Data skew is not an issue with Spark per se, rather it is a data problem. The cause of the data skew problem is the uneven distribution of the underlying data. Uneven partitioning is sometimes unavoidable in the overall data layout or the nature of the query.
For joins and aggregations Spark needs to co-locate records of a single key in a single partition. Records of a key will always be in a single partition. Similarly, other key records will be distributed in other partitions. If a single partition becomes very large it will cause data skew, which will be problematic for any query engine if no special handling is done.
Dealing with data skew
Data skew problems are more apparent in situations where data needs to be shuffled in an operation such as a join or an aggregation. Shuffle is an operation done by Spark to keep related data (data pertaining to a single key) in a single partition. For this, Spark needs to move data around the cluster. Hence shuffle is considered the most costly operation.
Common symptoms of data skew are
- Stuck stages & tasks
- Low utilization of CPU
- Out of memory errors
There are several tricks we can employ to deal with data skew problem in Spark.
Identifying and resolving data skew
Spark users often observe all tasks finish within a reasonable amount of time, only to have one task take forever. In all likelihood, this is an indication that your dataset is skewed. This behavior also results in the overall underutilization of the cluster. This is especially a problem when running Spark in the cloud, where over-provisioning of cluster resources is wasteful and costly.
If skew is at the data source level (e.g. a hive table is partitioned on _month key and table has a lot more records for a particular _month), this will cause skewed processing in the stage that is reading from the table. In such a case restructuring the table with a different partition key(s) helps. However, sometimes it is not feasible as the table might be used by other data pipelines in an enterprise.
In such cases, there are several things that we can do to avoid skewed data processing.
Data Broadcast
If we are doing a join operation on a skewed dataset one of the tricks is to increase the “spark.sql.autoBroadcastJoinThreshold” value so that smaller tables get broadcasted. This should be done to ensure sufficient driver and executor memory.
Data Preprocess
If there are too many null values in a join or group-by key they would skew the operation. Try to preprocess the null values with some random ids and handle them in the application.
Salting
In a SQL join operation, the join key is changed to redistribute data in an even manner so that processing for a partition does not take more time. This technique is called salting. Let’s take an example to check the outcome of salting. In a join or group-by operation, Spark maps a key to a particular partition id by computing a hash code on the key and dividing it by the number of shuffle partitions.
Let’s assume there are two tables with the following schema.
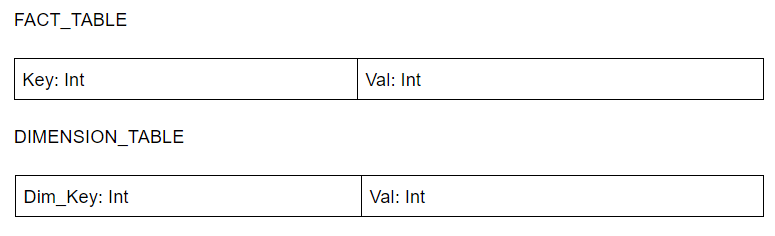
Let’s consider a case where a particular key is skewed heavily e.g. key 1, and we want to join both the tables and do a grouping to get a count. For example,
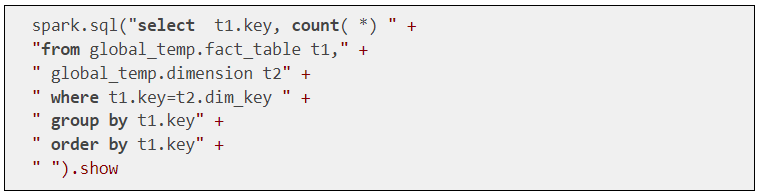
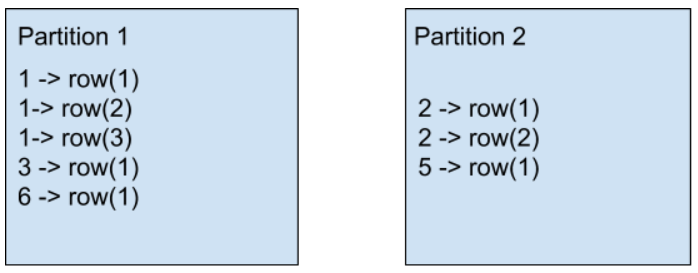
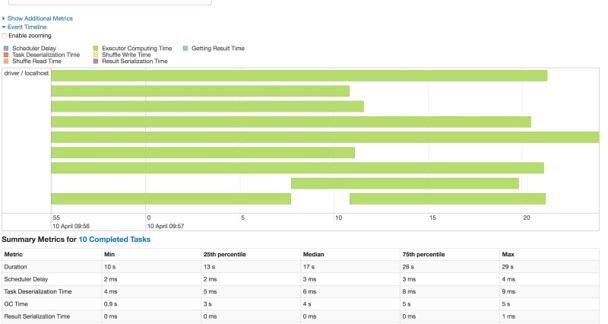
After the shuffle stage induced by the join operation, all the rows having the same key needs to be in the same partition. Look at the above diagram. Here all the rows of key 1 are in partition 1. Similarly, all the rows with key 2 are in partition 2. It is quite natural that processing partition 1 will take more time, as the partition contains more data. Let’s check Spark’s UI for shuffle stage run time for the above query.
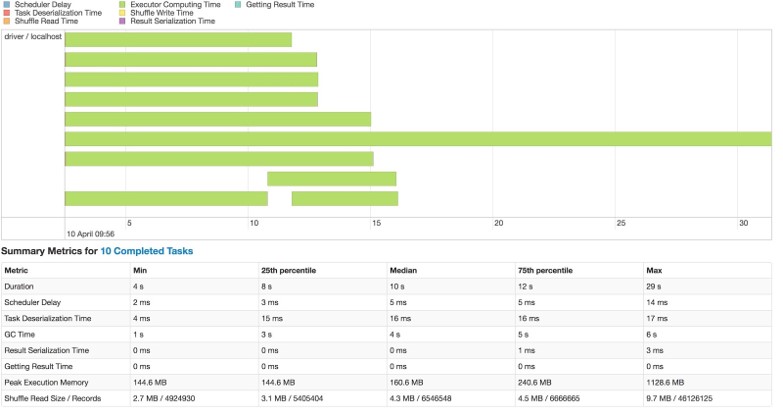
As we can see one task took a lot more time than other tasks. With more data it would be even more significant. Also, this might cause application instability in terms of memory usage as one partition would be heavily loaded.
Can we add something to the data, so that our dataset will be more evenly distributed? Most of the users with skew problem use the salting technique. Salting is a technique where we will add random values to join key of one of the tables. In the other table, we need to replicate the rows to match the random keys.The idea is if the join condition is satisfied by key1 == key1, it should also get satisfied by key1_<salt> = key1_<salt>. The value of salt will help the dataset to be more evenly distributed.
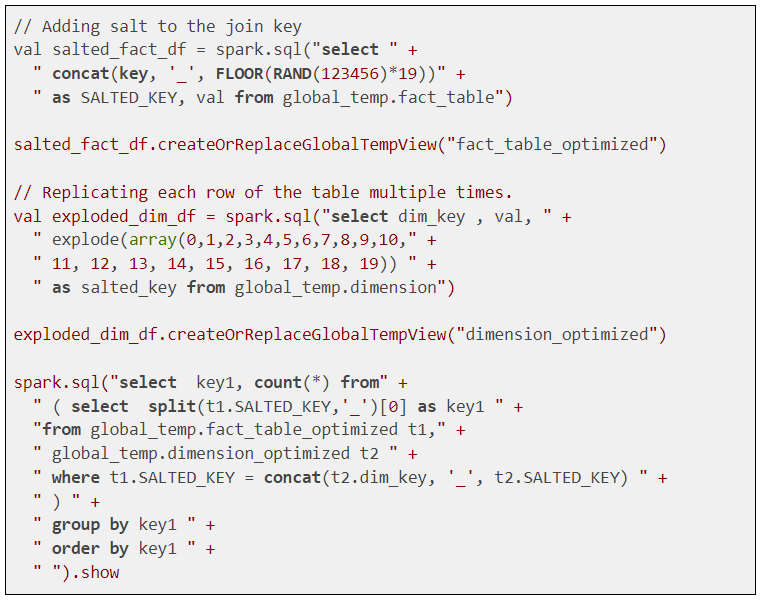
Here is an example of how to do that in our use case. Check the number 20, used while doing a random function & while exploding the dataset. This is the distinct number of divisions we want for our skewed key. This is a very basic example and can be improved to include only keys which are skewed.
Now let’s check the Spark UI again. As we can see processing time is more even now
Note that for smaller data the performance difference won’t be very different. Sometimes the shuffle compress also plays a role in the overall runtime. For skewed data, shuffled data can be compressed heavily due to the repetitive nature of data. Hence the overall disk IO/ network transfer also reduces. We need to run our app without salt and with salt to finalize the approach that best fits our case.
Garbage Collection
Spark runs on the Java Virtual Machine (JVM). Because Spark can store large amounts of data in memory, it has a major reliance on Java’s memory management and garbage collection (GC). Therefore, garbage collection (GC) can be a major issue that can affect many Spark applications.
Common symptoms of excessive GC in Spark are:
- Slowness of application
- Executor heartbeat timeout
- GC overhead limit exceeded error
Spark’s memory-centric approach and data-intensive applications make it a more common issue than other Java applications. Thankfully, it’s easy to diagnose if your Spark application is suffering from a GC problem. The Spark UI marks executors in red if they have spent too much time doing GC.
Spark executors are spending a significant amount of CPU cycles performing garbage collection. This can be determined by looking at the “Executors” tab in the Spark application UI. Spark will mark an executor in red if the executor has spent more than 10% of the time in garbage collection than the task time as you can see in the diagram below.
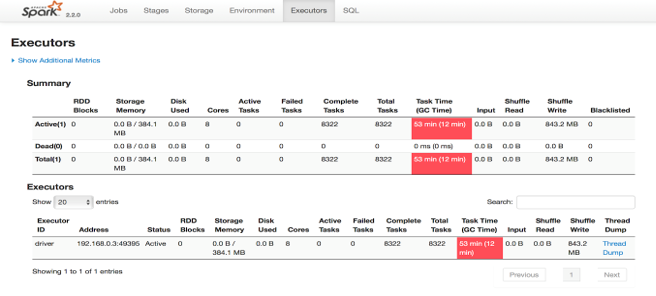
The Spark UI indicates excessive GC in red
Addressing garbage collection issues
Here are some of the basic things we can do to try to address GC issues.
Data structures
If using RDD based applications, use data structures with fewer objects. For example, use an array instead of a list.
Specialized data structures
If you are dealing with primitive data types, consider using specialized data structures like Koloboke or fastutil. These structures optimize memory usage for primitive types.
Storing data off-heap
The Spark execution engine and Spark storage can both store data off-heap. You can switch on off-heap storage using
- –conf spark.memory.offHeap.enabled = true
- –conf spark.memory.offHeap.size = Xgb.
Be careful when using off-heap storage as it does not impact on-heap memory size i.e. it won’t shrink heap memory. So to define an overall memory limit, assign a smaller heap size.
Built-in vs User Defined Functions (UDFs)
If you are using Spark SQL, try to use the built-in functions as much as possible, rather than writing new UDFs. Most of the SPARK UDFs can work on UnsafeRow and don’t need to convert to wrapper data types. This avoids creating garbage, also it plays well with code generation.
Be stingy about object creation
Remember we may be working with billions of rows. If we create even a small temporary object with a 100-byte size for each row, it will create 1 billion * 100 bytes of garbage.
End of Part II
So far, we have focused on memory management, data skew, and garbage collection as causes of slowdowns and failures in your Spark applications. For Part III of the series, we will turn our attention to resource management and cluster configuration where issues such as data locality, IO-bound workloads, partitioning, and parallelism can cause some real headaches unless you have good visibility and intelligence about your data runtime.
If you found this blog useful, you may wish to view Part I of this series Why Your Spark Apps are Slow or Failing: Part I Memory Management. Also see our blog Spark Troubleshooting, Part 1 – Ten Challenges.