


Post by George Demarest, Senior Director of Product Marketing, Unravel and Abha Jain, Director Products, Unravel. This blog was first published on the Amazon Startup blog.
A household name in global media analytics – let’s call them MTI – is using Unravel to support their data operations (DataOps) on Amazon EMR to establish and protect their internal service level agreements (SLAs) and get the most out of their Spark applications and pipelines. Amazon EMR was an easy choice for MTI as the platform to run all their analytics. To start with, getting up and running is simple. There is nothing to install, no configuration required etc. and you can get to a functional cluster in a few clicks. This enabled MTI to focus most of their efforts in building out analytics that would benefit their business instead of having to spend time and money on acquiring the skillset needed for setting up and maintaining Hadoop deployments by themselves. MTI was very quickly able to get a point that they were running 10’s of thousands of jobs per week. About 70% of which are Spark, with the remaining 30% of workloads running on Hadoop, or more specifically Hive/MapReduce.
Among the most common complaints and concerns about optimizing modern data stack clusters and applications is the amount of time it takes to root-cause issues like application failures or slowdowns or to figure out what needs to be done to improve performance. Without context, performance and utilization metrics from the underlying data platform and the Spark processing engine can laborious to collect and correlate, and difficult to interpret.
Unravel employs a frictionless method of collecting relevant data about the full data stack, running applications, cluster resources, datasets, users, business units and projects. Unravel then aggregates and correlates this data into the Unravel data model and then applies a variety of analytical techniques to put that data into a useful context. Unravel utilizes EMR bootstrap Actions to distribute (non-intrusive) sensors on each node of a new cluster that are needed for collecting granular application level data which in turn is used to optimize applications.
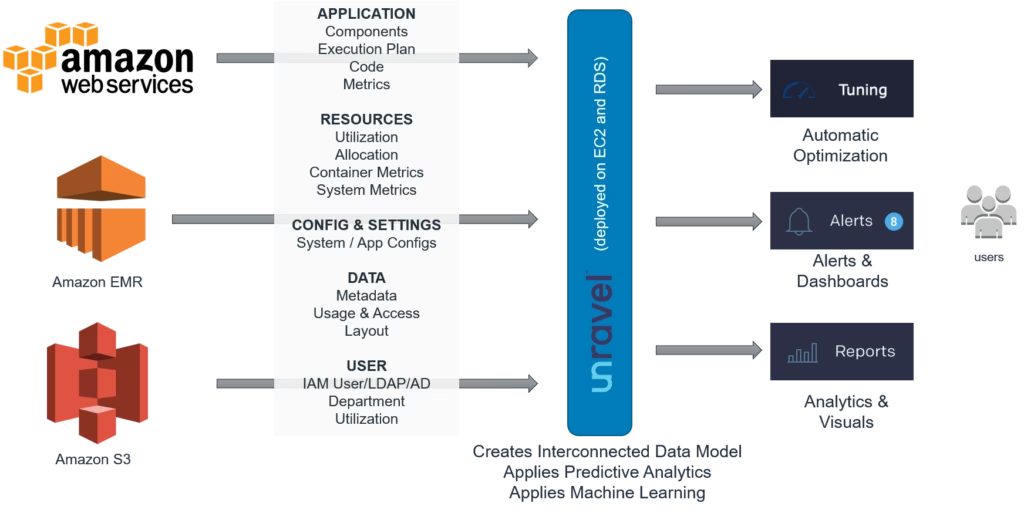
Unravel’s Amazon AWS/EMR architecture
MTI has prioritized their goals for big data based on two main dimensions that are reflected in the Unravel product architecture: Operations and Applications.
Optimizing Data Operations For MTI’s cluster level SLAs and operational goals for their big data program, they identified the following requirements:
● Reduce time needed for troubleshooting and resolving issues.
● Improve cluster efficiency and performance.
● Improve visibility into cluster workloads.
● Provide usage analysis
Reducing Time to Identify and Resolve Issues One of the most basic requirements for creating meaningful SLAs is to set goals for identifying problems or failures – known as Mean Time to Identification (MTTI) – and the resolution of those problems – known as Mean Time to Resolve (MTTR). MTI executives set a goal of 40% reduction in MTTR.
One of the most basic ways that Unravel helps reduce MTTI/MTTR is through the elimination of the time-consuming steps of data collection and correlation. Unravel collects granular cluster and application-specific runtime information, as well as metrics on infrastructure, resources using native Hadoop APIs and via lightweight sensors that only send data while an application is executing. This alone can save data teams hours – if not days – of data collection by, capturing application and system log data, configuration parameters, and other relevant data.
Once that data is collected, the manual process of evaluating and interpreting that data has just begun. You may spend hours charting log data from your Spark application only to find that some small human error, a missed configuration parameter, and incorrectly sized container, or a rogue stage of your Spark application is bringing your cluster to its knees.
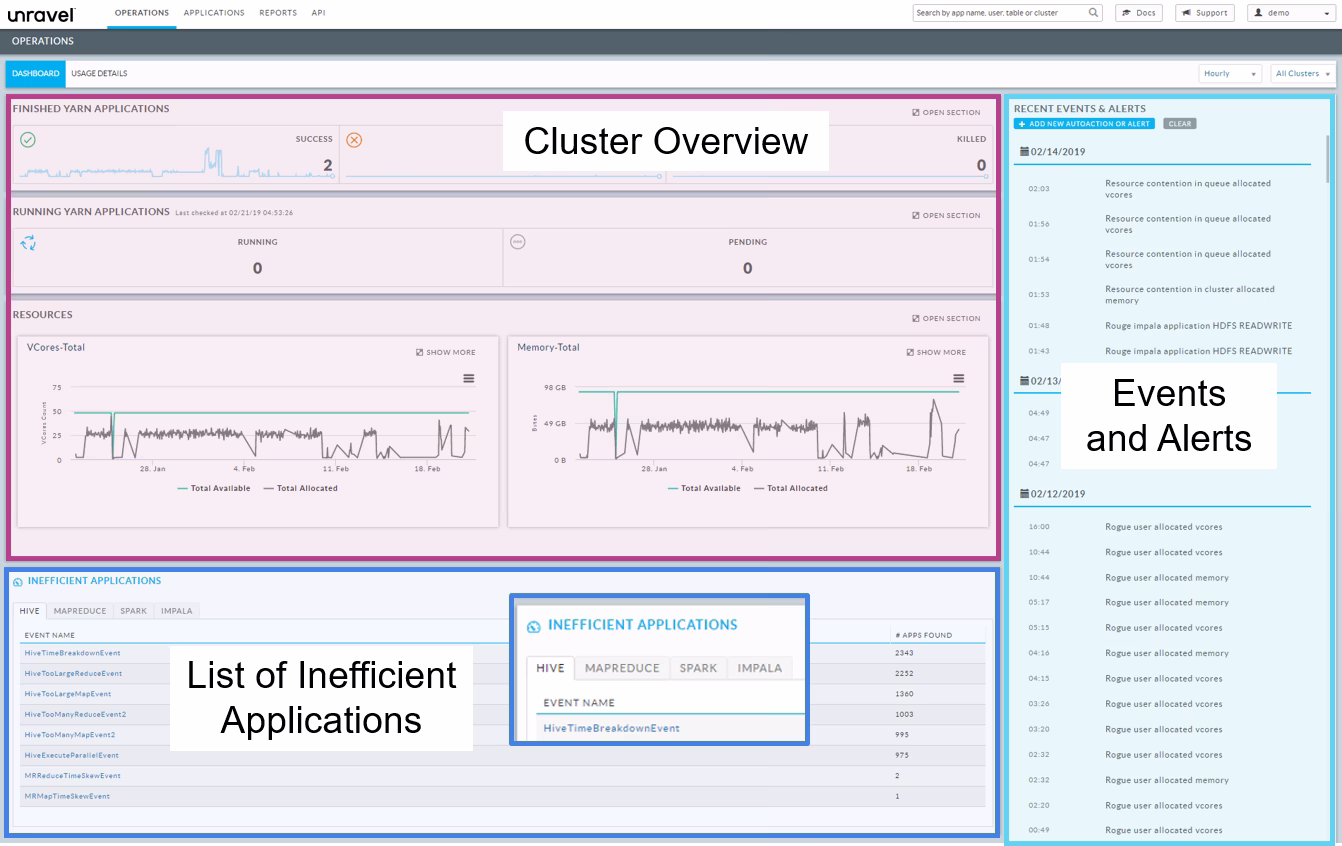
Unravel’s top level operations dashboard
Improving Visibility Into Cluster Operations In order for MTI to establish and maintain their SLAs, they needed to troubleshoot cluster-level issues as well as issues at the application and user levels. For example, MTI wanted to monitor and analyze the top applications by duration, resources usage, I/O, etc. Unravel provides a solution to all of these requirements.
Cluster Level Reporting Cluster level reporting and drill down to individual nodes, jobs, queues, and more is a basic feature of Unravel.
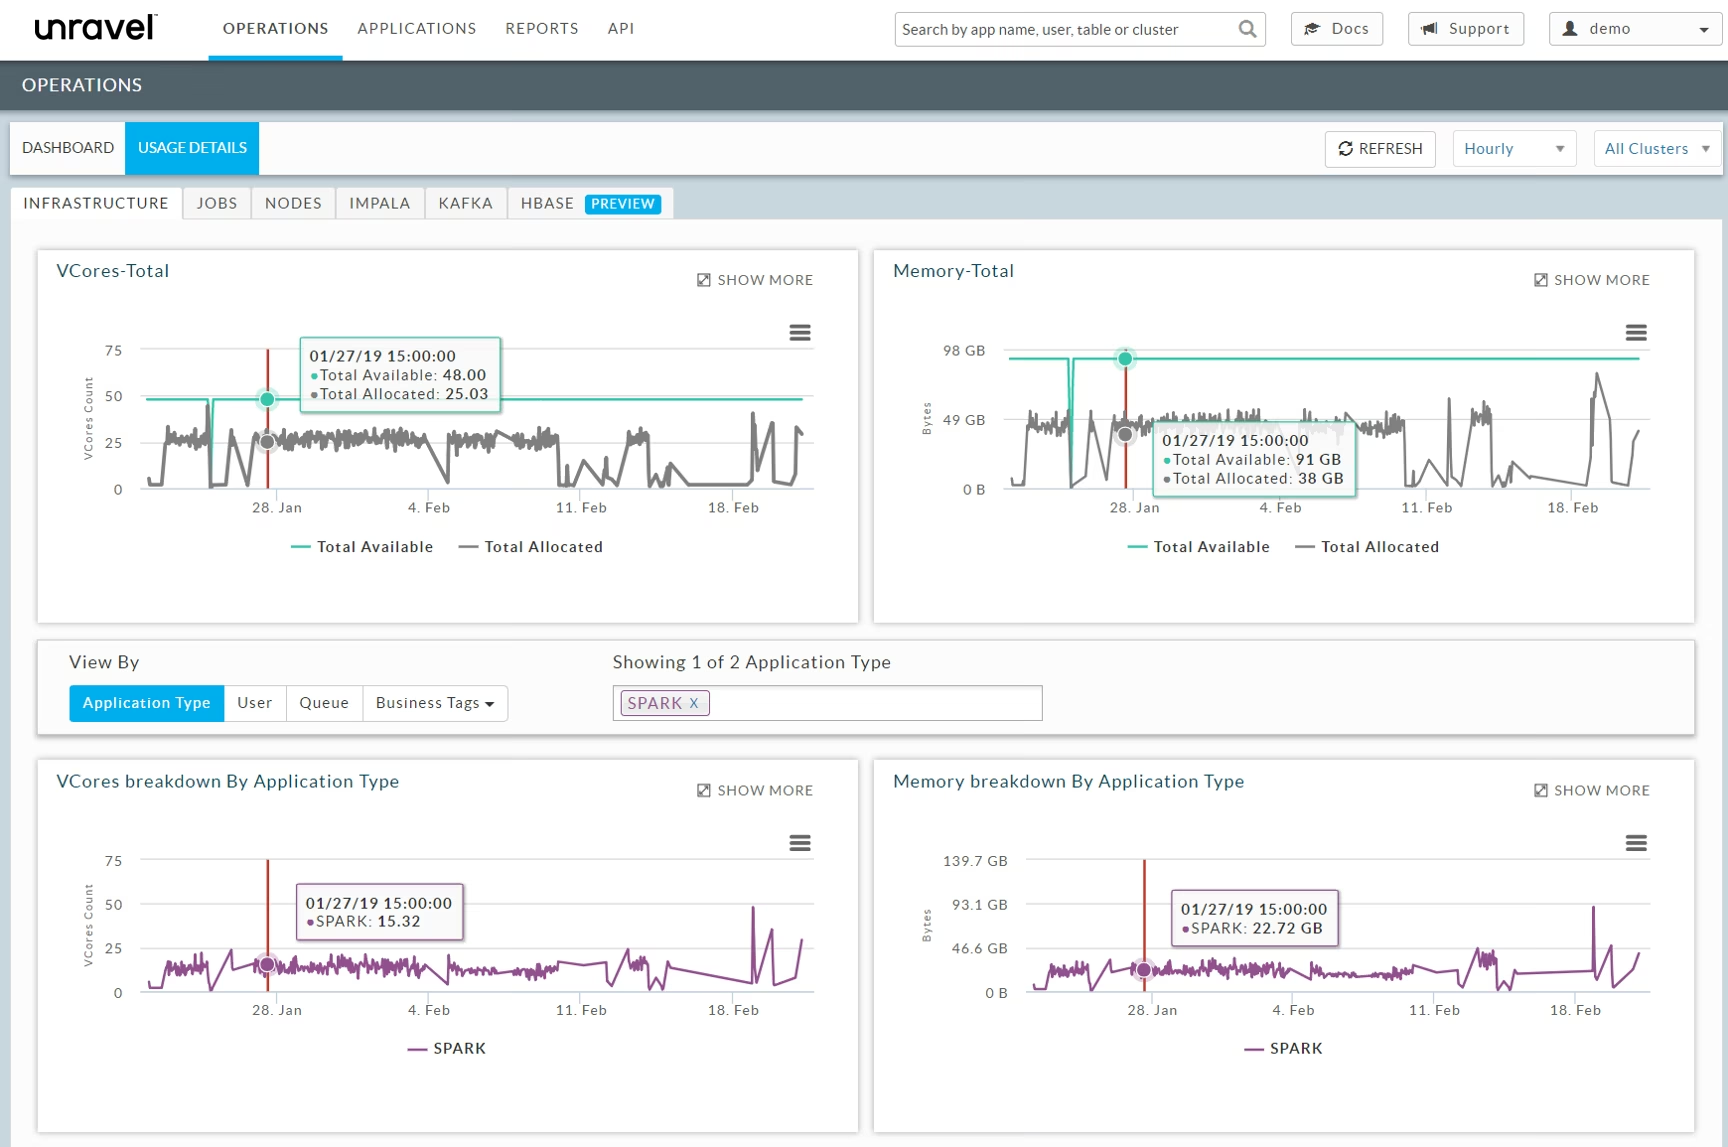
Unravel’s cluster infrastructure dashboard
One observation from reports like the above was that the memory and CPU usage in the cluster was peaking from time to time, potentially leading to application failures and slowdowns. To resolve this issue, MTI utilized EMR Automatic scaling feature so that instances were automatically added and removed as needed to ensure adequate resources at all times. This also ensured that they were not incurring unnecessary costs from underutilized resources.
Application and Workflow Tagging Unravel provides rich functionality for monitoring applications and users in the cluster. Unravel provides cluster and application reporting by user, queue, application type and custom tags like Project, Department etc. These tags are preconfigured so that MTI can instantly filter their view by these tags. The ability to add custom tags is unique to Unravel and enables customers to tag various applications based on custom rules specific to their business requirements (e.g. Project, business unit, etc.).
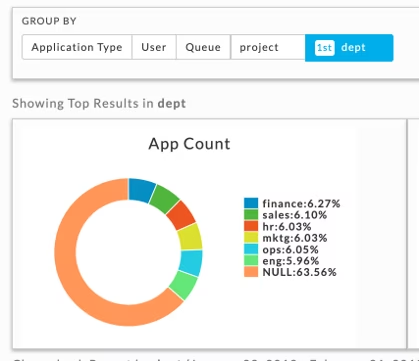
Unravel application tagging by department
Usage Analysis and Capacity Planning MTI wants to be able to maintain service levels over the long term, and thus require reporting on cluster resource usage, and data on future capacity requirements for their program. Unravel provides this type of intelligence through the Chargeback/showback reporting.
Unravel Chargeback Reporting You can generate ChargeBack reports in Unravel for multi-tenant cluster usage costs associated by the Group By options: application type, user, queue, and tags. The window is divided into three (3) sections,
- Donut graphs showing the top results for the Group by selection.
- Chargeback report showing costs, sorted by the Group By choice(s).
- List of Yarn applications running.
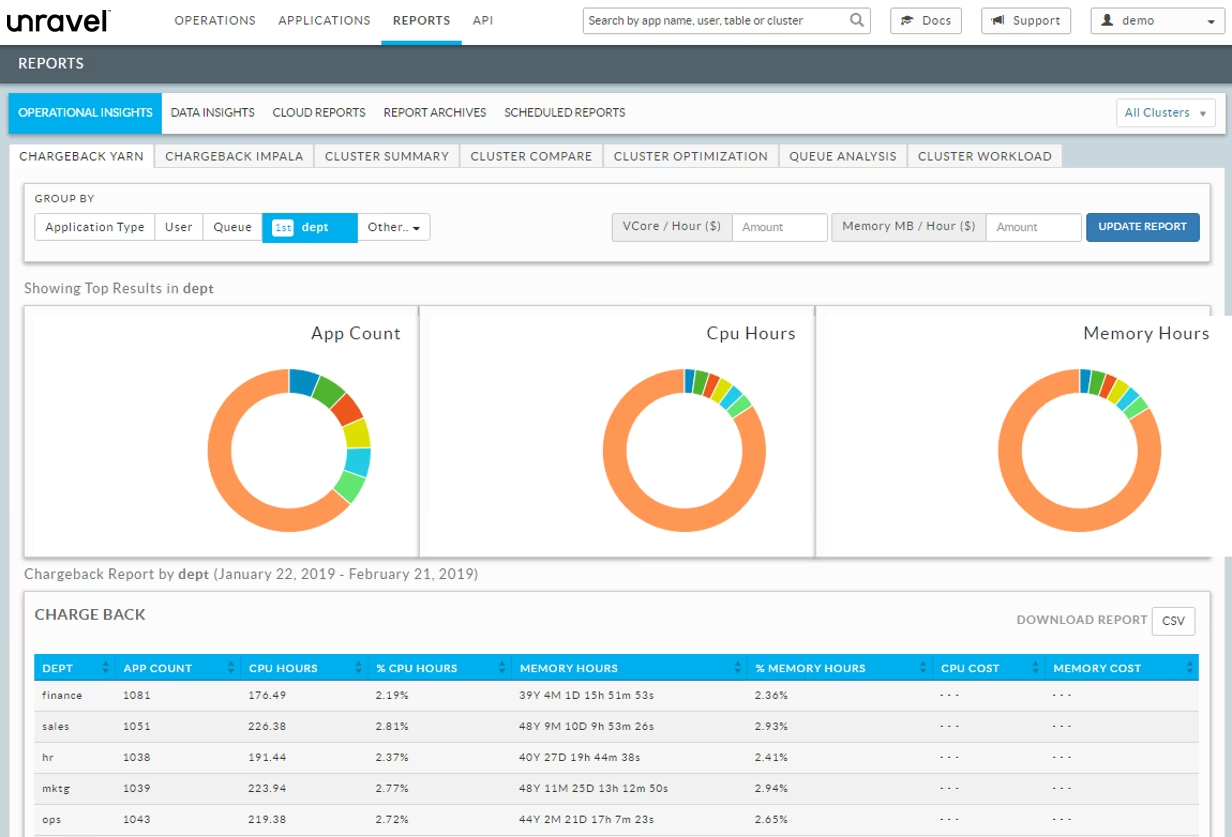
Unravel Data’s chargeback reporting
Improving Cluster Efficiency and Performance MTI wanted to be able to predict and anticipate application slowdowns and failures before they occur. by using Unravel’s proactive alerting and auto-actions so that they could, for example, find runaway queries and rogue jobs, detect resource contention, and then take action.
Unravel Auto-actions and Alerting Unravel Auto-actions are one of the big points of differentiation over the various monitoring options available to data teams such as Cloudera Manager, Splunk, Ambari, and Dynatrace. Unravel users can determine what action to take depending on policy-based controls that they have defined.
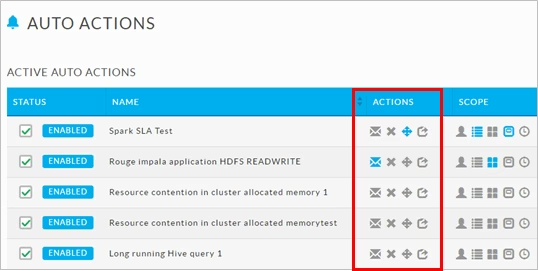 Unravel Auto-actions set up
The simplicity of the Auto-actions screen belies the deep automation and functionality of autonomous remediation of application slowdowns and failures. At the highest level, Unravel Auto-actions can be quickly set up to alert your team via email, PagerDuty, Slack or text message. Offending jobs can also be killed or moved to a different queue. Unravel can also create an HTTP post that gives users a lot of powerful options
Unravel also provide a number of powerful pre-built Auto-action templates that can give users a big head start on crafting the precise automation they wish for their environment.
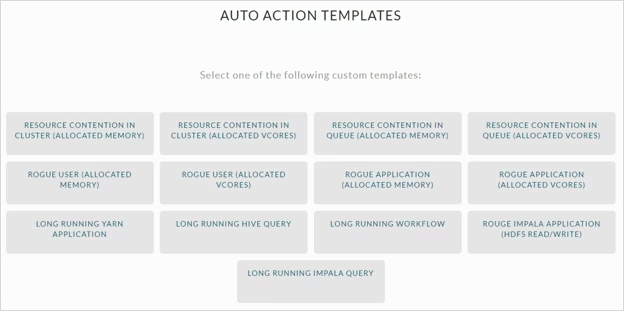
Pre-configured Unravel auto-action templates
Applications Turning to MTI’s application-level requirements, the company was looking at improving overall visibility into their data application runtime performance, and to encourage a self-service approach to tuning and optimizing their Spark applications.
Increased Visibility Into Application Runtime and Trends MTI data teams, like many, are looking for that elusive “single pane of glass” for troubleshooting slow and failing Spark jobs and applications. They were looking to:
- Visualize app performance trends, viewing metrics such as applications start time, duration, state, I/O, memory usage, etc.
- View application component (pipeline stages) breakdown and their associated performance metrics
- Understand execution of Map Reduce jobs, Spark applications and the degree of parallelism and resource usage as well as obtain insights and recommendations for optimal performance and efficiency
Because typical data pipelines are built on a collection of distributed processing engines (Spark, Hadoop, et al.), getting visibility into the complete data pipeline is a challenge. Each individual processing engine may have monitoring capabilities, but there is a need to have a unified view to monitor and manage all the components together.
Unravel Monitoring, Tuning, and Troubleshooting
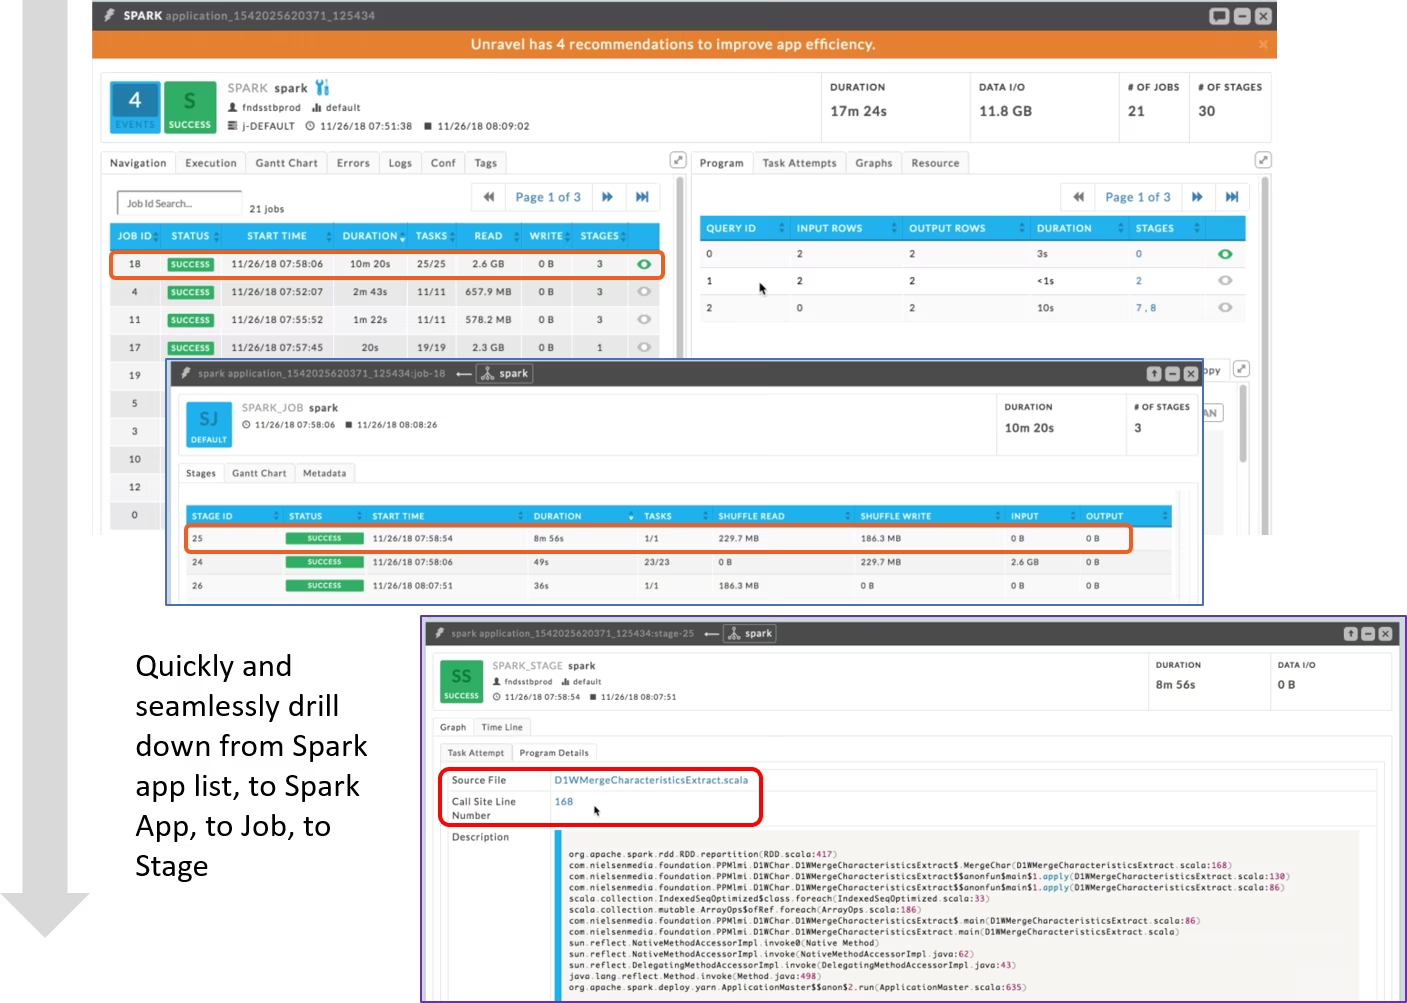
Intuitive drill-down from Spark application list to an individual data pipeline stage
Unravel was designed with an end-to-end perspective on data pipelines. The basic navigation moves from the top level list of applications to drill down to jobs, and further drill down to individual stages of a Spark, Hive, MapReduce or Impala applications.
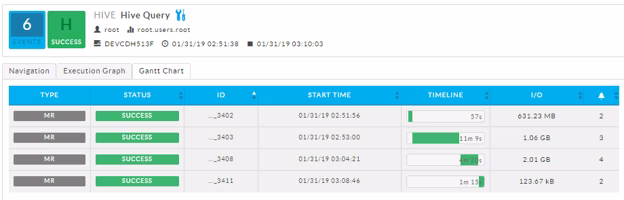
Unravel Gantt chart view of a Hive query
Unravel provides a number of intuitive navigational and reporting elements in the user interface including a Gantt chart of application components to understand the execution and parallelism of your applications.
Unravel Self-service Optimization of Spark Applications MTI has placed an emphasis on creating a self-service approach to monitoring, tuning, and management of their data application portfolio. They are for development teams to reduce their dependency on IT and at the same time to improve collaboration with their peers. Their targets in this area include:
- Reducing troubleshooting and resolution time by providing self-service tuning
- Improving application efficiency and performance with minimal IT intervention
- Provide Spark developers performance issues and relate directly to the lines of code associated with a given step.
MTI has chosen Unravel as a foundational element of their self-service application and workflow improvements, especially taking advantage of application recommendations and insights for Spark developers.
Unravel self-service capabilities
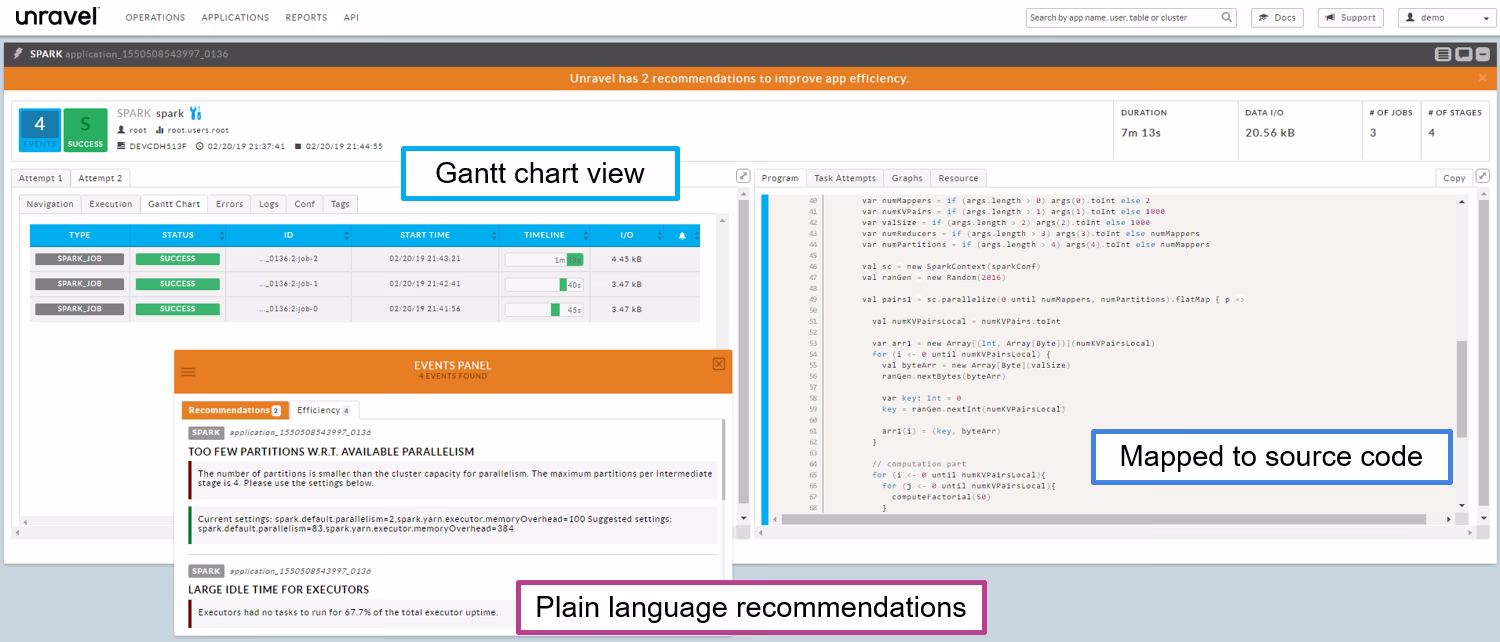
Unravel provides plain language insights as well as specific, actionable recommendations to improve performance and efficiency. In addition to these recommendations and insights, users can take action via the auto-tune function, which is available to run from the events panel.
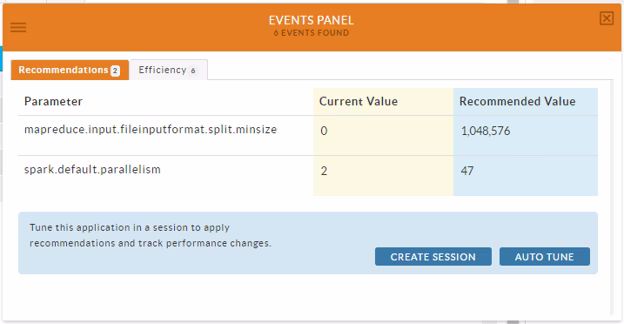
Intelligent recommendations and insights as well as auto-tuning
Optimizing Application Resource Efficiency In large scale data operations, the resource efficiency of the entire cluster is directly linked to the efficient use of cluster resources at the application level. As data teams can routinely run hundreds or thousands of job per day, an overall increase in resource efficiency across all workloads improves the performance, scalability and cost of operation of the cluster.
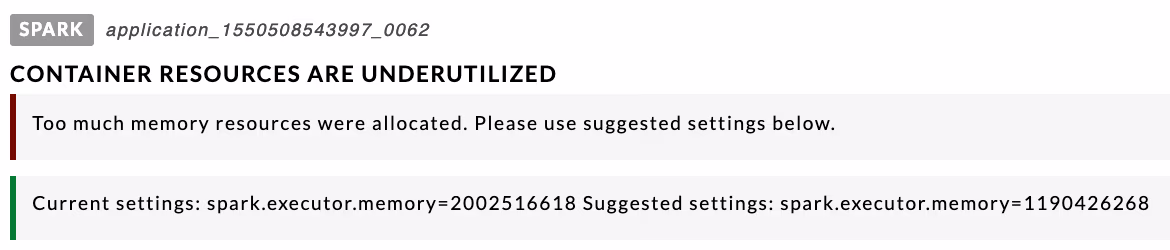
Unravel provides a rich catalog of insights and recommendations around resource consumption at the application level. To eliminate resource wastage Unravel can help you run your data applications more efficiently by providing you AI driven insights and recommendations to do show:
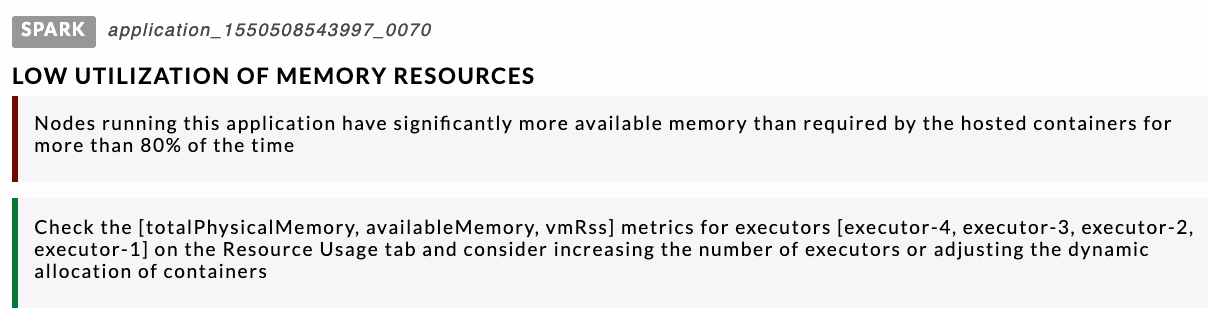
Underutilization of Container Resources, CPU, or Memory
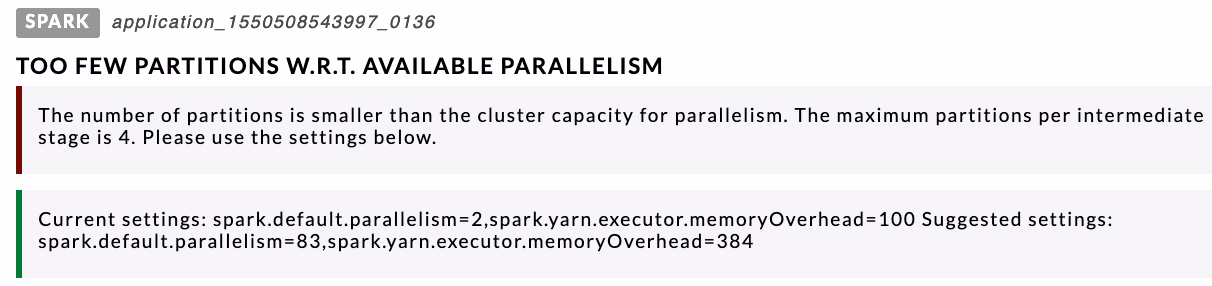
Too few partitions with respect to available parallelism
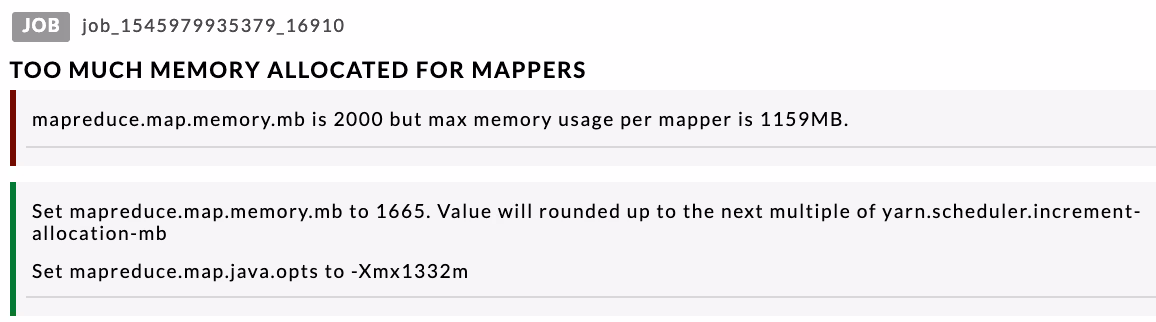
Mapper/Reducers Requesting Too Much Memory
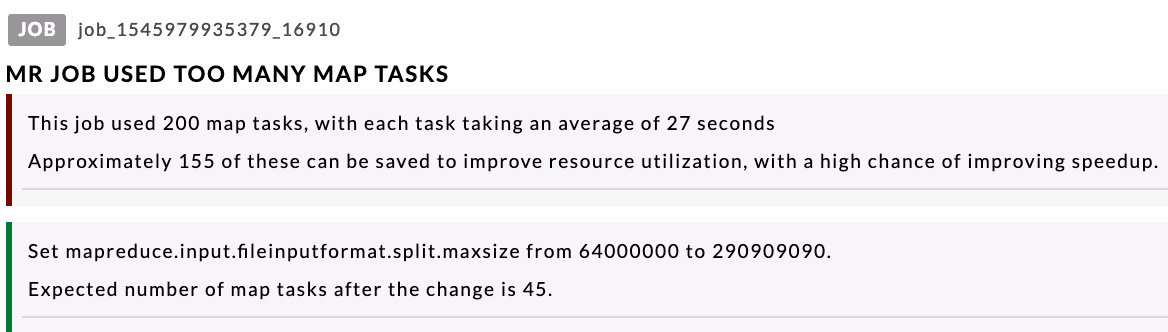
Too Many Map Tasks and/or Too Many Reduce Tasks
Solution Highlights Work on all of these operational goals is ongoing with MTI and Unravel, but to date, they have made significant progress on both operational and application goals. After running for over a month on their production computation cluster, MTI were able to capture metrics for all MapReduce and Spark jobs that were executed.
MTI also got great insights on the number and causes of inefficiently running applications. Unravel detected a significant number of inefficient applications. Unravel detected 38,190 events after analyzing 30,378 MapReduce jobs that they executed. They were also able to detect 44,176 events for 21,799 Spark jobs that they executed. They were also able to detect resource contention which causing Spark jobs to get stuck in “Accepted” state, rather than running to completion.
During a deep dive on their applications, MTI found multiple inefficient jobs where Unravel provided recommendations for repartitioning the data. They were also able to identify many jobs which waste CPU and memory resources.