


Your data engineering team just wrapped their daily standup. Three developers are collaborating on a new pipeline, switching between notebooks every few minutes. Meanwhile, your nightly ETL job that takes two hours is chugging along on an interactive cluster that’s been running for 18 hours straight.
At the end of the month, your Databricks bill arrives and it’s 60% higher than projected.
Sound familiar?
The confusion between Databricks interactive clusters and job clusters costs organizations tens of thousands of dollars monthly. Interactive clusters offer immediate response times and seamless collaboration. Perfect for development work. But use them for the wrong workloads and you’re essentially burning cash on idle compute time.
This guide provides the complete decision framework for choosing between interactive and job clusters, helping you maximize your Databricks investment while maintaining team productivity.
Understanding Databricks Interactive Clusters and All-Purpose Compute
Databricks interactive clusters, also called all-purpose clusters, are designed for collaborative data analysis and development work. You create these clusters using the Databricks UI, CLI, or REST API. Multiple users can share them simultaneously for interactive analysis. Unlike job clusters that terminate automatically after completing their tasks, interactive clusters persist until you manually terminate them or they hit their auto-termination threshold.
The architecture of Databricks interactive clusters makes them ideal for exploratory work. Launch a notebook command and the cluster responds immediately because the Spark context is already initialized and running. No startup delay. No waiting for driver and worker nodes to spin up. This instant response matters enormously when you’re iterating on code, testing transformations, or exploring datasets interactively.
Databricks interactive clusters support all programming languages available in Databricks: Python, Scala, R, and SQL. They integrate seamlessly with notebooks, allowing multiple users to attach to the same cluster and work collaboratively. When your data science team needs to review results together, troubleshoot a tricky transformation, or pair program on a complex pipeline, interactive clusters provide the shared environment that makes this collaboration possible.
The cluster autoscaling capability in Databricks interactive clusters helps match resources to workload demands. Query complexity increases? The cluster automatically adds worker nodes. Activity drops? It scales back down. Databricks uses optimized autoscaling that scales down even when the cluster isn’t completely idle, looking at shuffle file state to make intelligent decisions about resource allocation.
All-purpose clusters in Databricks come with access mode settings that determine security and collaboration capabilities. Shared access mode allows multiple users with proper Unity Catalog permissions to work on the same cluster. Single-user mode dedicates the cluster to one user. No isolation mode provides direct access to cloud storage without Unity Catalog governance.
Quick Decision Table

Clear Trade-offs Comparison

The 15-Minute Rule
A simple guideline for cluster selection based on job duration and startup overhead:
- Job duration > 15 minutes: Consider job cluster
- Job duration < 15 minutes: Use interactive cluster
- Startup overhead > 25%: Definitely use interactive
The job cluster startup overhead (typically three to five minutes) represents 20% to 33% of total execution time for a 15-minute task. That overhead becomes acceptable waste when you’re only running one task per day, but multiply it across 20 daily executions and you’ve wasted an hour of cluster time just on startups.
For a 60-minute ETL job, that five-minute startup represents just 8% overhead. Completely acceptable. But for a five-minute data validation query, that same startup time creates 50% overhead, effectively doubling your compute cost.
Cost Impact Examples
Job Cluster Economics
Example: Daily ETL Job
- Job runtime: 60 minutes
- Startup time: 5 minutes
- Total cluster time: 65 minutes
- Startup overhead: 8% (acceptable)
- Cost: Pay for 65 minutes only ✅
Interactive Cluster Economics
Example: Data Science Team
- Cluster runs: 8 hours/day (business hours)
- Actual usage: 3 hours/day
- Utilization: 37.5%
- Waste: 62.5% of cost ❌
- BUT: Zero wait time for users ✅
DBU costs for all-purpose clusters run approximately twice as high as job cluster costs. On AWS, for example, an r5.4xlarge instance costs 0.75 DBU per hour for a job cluster but 1.50 DBU per hour for an interactive cluster.
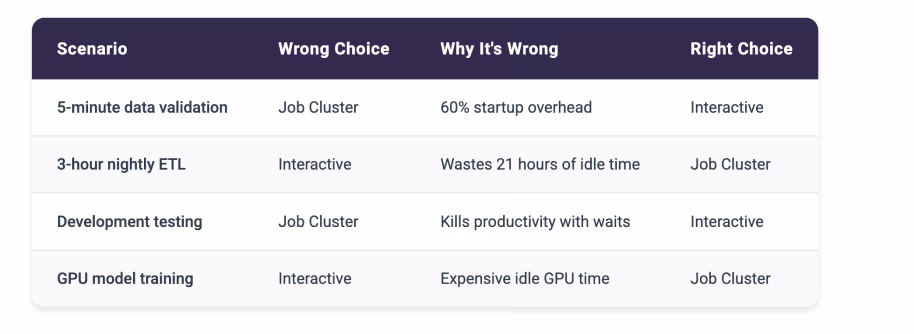
Common Mistakes
These wrong cluster choices create the most expensive waste:
Stop wasting Databricks spend—act now with a free health check.
Request Your Databricks Health Check ReportHybrid Strategy
Many organizations use both cluster types strategically:
Business Hours: Interactive Clusters
- Data science teams working 9 AM – 6 PM
- Dashboard serving user queries
- Development and testing activities
Off Hours: Job Clusters
- ETL pipelines running 2 AM – 6 AM
- ML training jobs overnight
- Batch reporting on weekends
Always Job Clusters
- Production data pipelines
- Scheduled business reports
- ML model training
- Data quality monitoring
Always Interactive
- Real-time dashboards
- Data exploration workloads
- Development environments
- User-facing analytics
The Hidden Complexity of Enterprise-Scale Cluster Management
Managing Databricks interactive clusters at enterprise scale introduces operational challenges that require additional intelligence beyond what standard Databricks monitoring is designed to provide. Databricks excels at infrastructure-level metrics and cluster performance data. Teams often need a complementary layer focused specifically on cost optimization patterns and automated remediation.
Cost tracking becomes complex when multiple teams share interactive clusters or when clusters serve mixed workloads. Databricks provides comprehensive cost reports showing spending on all-purpose clusters. Organizations often need an additional analytical layer to break down utilization patterns by team, identify specific optimization opportunities, and automate responses to inefficient usage. Without detailed visibility, you can’t hold teams accountable for their cluster usage or identify where optimization efforts should focus.
The challenge intensifies when dealing with cluster sprawl. Development teams create interactive clusters for specific projects or experiments and forget to terminate them. These orphaned clusters continue running and accruing costs long after the work completes. One common pattern: a developer spins up a cluster Friday afternoon to test something, forgets about it over the weekend, and the cluster runs for 60 hours straight before the Monday morning termination window finally shuts it down.
Performance validation across interactive clusters creates opportunities for additional optimization intelligence. You might know a cluster is running, but do you know if it’s properly sized? Is that eight-node cluster actually using all eight workers, or could it run just as effectively on four nodes? Databricks provides some metrics on cluster utilization, but connecting those metrics to specific cost impacts and optimization opportunities requires significant analysis effort.
The problem of choosing between interactive and job clusters multiplies across an organization. Different teams make inconsistent decisions:
- Your data science team might run short validation queries on expensive interactive clusters
- Your data engineering team wastes time waiting for job clusters to start for 20-minute development tasks
- Marketing analytics leaves clusters running 24/7 for dashboards that only get checked twice a day
- Finance spins up new clusters for every monthly report instead of reusing existing ones
Without centralized visibility and consistent decision frameworks, these inefficiencies compound into substantial unnecessary costs.
Cluster configuration decisions lack the intelligence to adapt to actual usage patterns. You configure an interactive cluster based on estimated requirements, but actual usage might be quite different. The cluster might be oversized for typical workloads or undersized for peak loads. Databricks autoscaling helps, but it operates within the minimum and maximum boundaries you initially set. If those boundaries are wrong, you’re either wasting money on excess capacity or throttling performance with insufficient resources.
How Unravel’s FinOps Agent Provides Intelligence for Cluster Decisions
Unravel’s FinOps Agent complements Databricks by providing an actionable intelligence layer specifically designed for cluster cost optimization and governance. Built natively on Databricks System Tables using Delta Sharing, the FinOps Agent requires no agents or connectors to deploy. It continuously analyzes every cluster execution pattern with secure, direct access to your Databricks metadata and implements optimizations based on your governance preferences.
The FinOps Agent moves beyond traditional observability tools that simply flag issues and leave implementation entirely manual. When the agent identifies that an interactive cluster is oversized or running idle, it doesn’t generate another dashboard alert. It implements the fix automatically based on your governance preferences. This progression from insight to automated action is what differentiates Unravel from monitoring platforms.
You control the automation level:
- Start with recommendations requiring manual approval to build confidence
- Enable auto-approval for specific optimization types like terminating idle clusters after business hours
- Progress to full automation with governance controls for proven optimizations like rightsizing underutilized interactive clusters
Organizations using Unravel’s FinOps Agent achieve 25–35% sustained cost reduction on their Databricks spending. That translates to running 50% more workloads for the same budget or reallocating hundreds of thousands of dollars from wasted compute to productive data initiatives. The FinOps Agent specifically addresses interactive cluster waste by identifying clusters left running unnecessarily, rightsizing oversized configurations, and recommending when workloads should migrate from expensive all-purpose clusters to more economical job clusters.
The FinOps Agent operates continuously and autonomously, unlike traditional monitoring tools that require manual review of dashboards and manual implementation of every optimization. When a cluster runs idle overnight, the agent doesn’t wait for someone to notice and take action. It automatically terminates the cluster based on your governance rules, immediately stopping the cost drain.
Other Useful Links
- Our Databricks Optimization Platform
- Get a Free Databricks Health Check
- Check out other Databricks Resources