

In today’s data-driven world, there is a huge amount of data flowing into the business. Engineers spend a large part of their time in building pipelines—to collect the data from different sources, process it, and transform it to useful datasets that can be sent to business intelligence applications or machine learning models. Tools like Airflow are used to orchestrate complex data pipelines by programmatically authoring, scheduling, and monitoring the workflow pipelines. From a 10,000-foot view, Airflow may look like just a powerful cron, but it has additional capabilities like monitoring, generating logs, retrying jobs, adding dependencies between tasks, enabling a huge number of operators to run different types of tasks, etc.
Pipelines become increasingly complex because of the interdependence of several tools needed to complete a workflow. Common tasks done in day-to-day pipeline activities call for a number of different technologies to process data for different purposes: running a Spark job, executing a Snowflake query, executing a data transfer across different platforms (like from a GCS bucket to an AWS S3 bucket), and pushing data into a queue system like SQS.
Airflow orchestrates pipelines running several third-party tools and supports about 80 different providers. But you need to monitor what’s going on underneath pipeline operations across all those tools and get deeper insights about pipeline execution. Unravel supports this by bringing in all the information monitored from Airflow via API, StatsD, and notifications. Unravel also collects metrics from Spark, BigQuery, Snowflake to connect the dots to find out how the pipeline execution in Airflow impacts other systems.
Let’s examine two common use cases to illustrate how Unravel stitches together all pipeline details to solve problems that you can’t address with Airflow alone.
View DAG Run Information
Let’s say a financial services company is using Airflow to run Spark jobs on their instances and notices that a few of the DAG runs are taking longer to complete. Airflow UI shows information about the duration of each task run and the status of the task run, but that’s about it. For deeper insight into why the runs are taking longer, you’d need to gather detailed information about the Spark ID that is created via this task run.
By tightly integrating with the Spark ecosystem, Unravel fills that gap and gives you deeper insights about the Spark job run, its duration, and the resource utilized. These details, along with information collected from Airflow, can help you see the bigger picture of what’s happening underneath, inside your data pipelines.
This is an example test_spark DAG that runs the Spark job via the SparkSubmitOperator in the company’s environment. The SparkSubmitOperator task is taking longer to execute, and the screen shot below shows the long duration of the Spark submit task.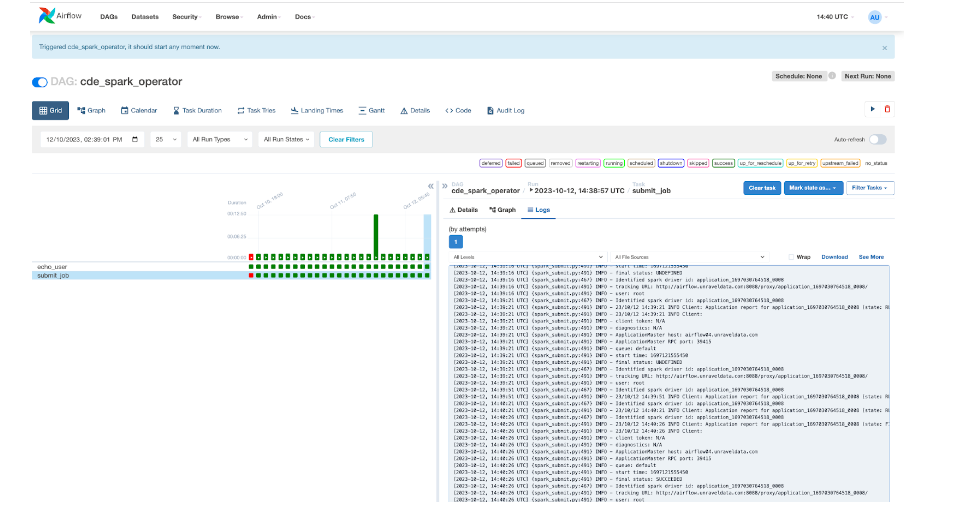 This information flows into Unravel and is visualized in the Pipeline Observer UI. A summary list of failed/degraded pipeline runs helps to filter DAG runs with problems to debug. Clicking on a specific pipeline run ID drills down into more information about the pipeline, e.g., detailed information about the task, duration of each task, total duration, baseline compared to previous runs, and stack traces about the failure.
 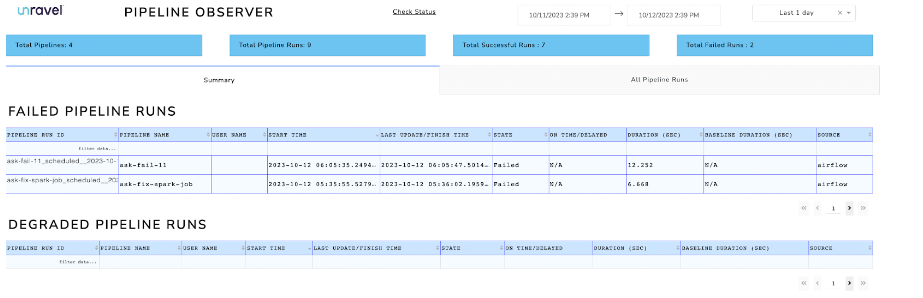 Unravel also shows a list of all pipeline runs.
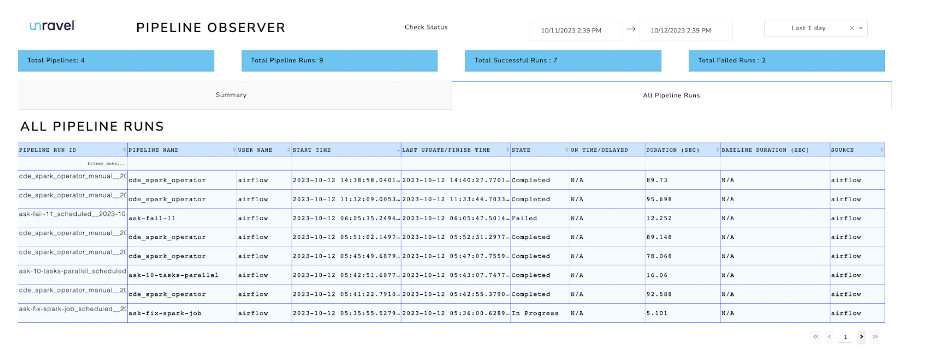 Clicking on one of the Spark DAG runs with a long duration reveals more detailed information about the DAG and allows comparison with previous DAG runs. You can also find information about the Spark ID that is run for this particular DAG.
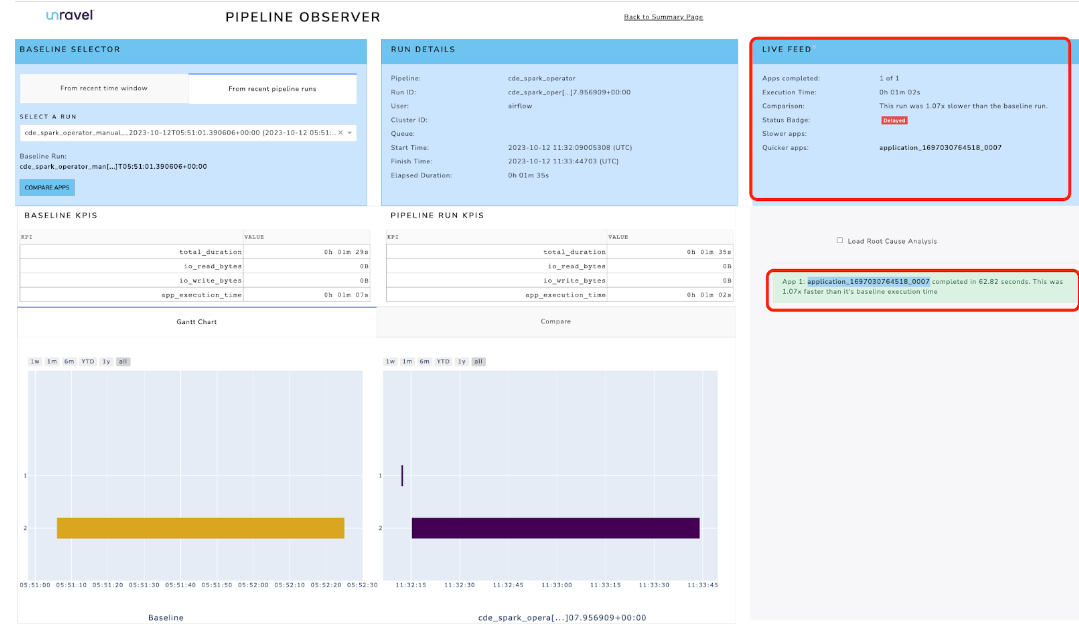 Clicking on the Spark app ID takes you to the Unravel UI with more information about the Spark job that is collected from Spark: the resources used to run the Spark job, any error logs, configurations made to run that Spark job, duration of the Spark jobs, and more.
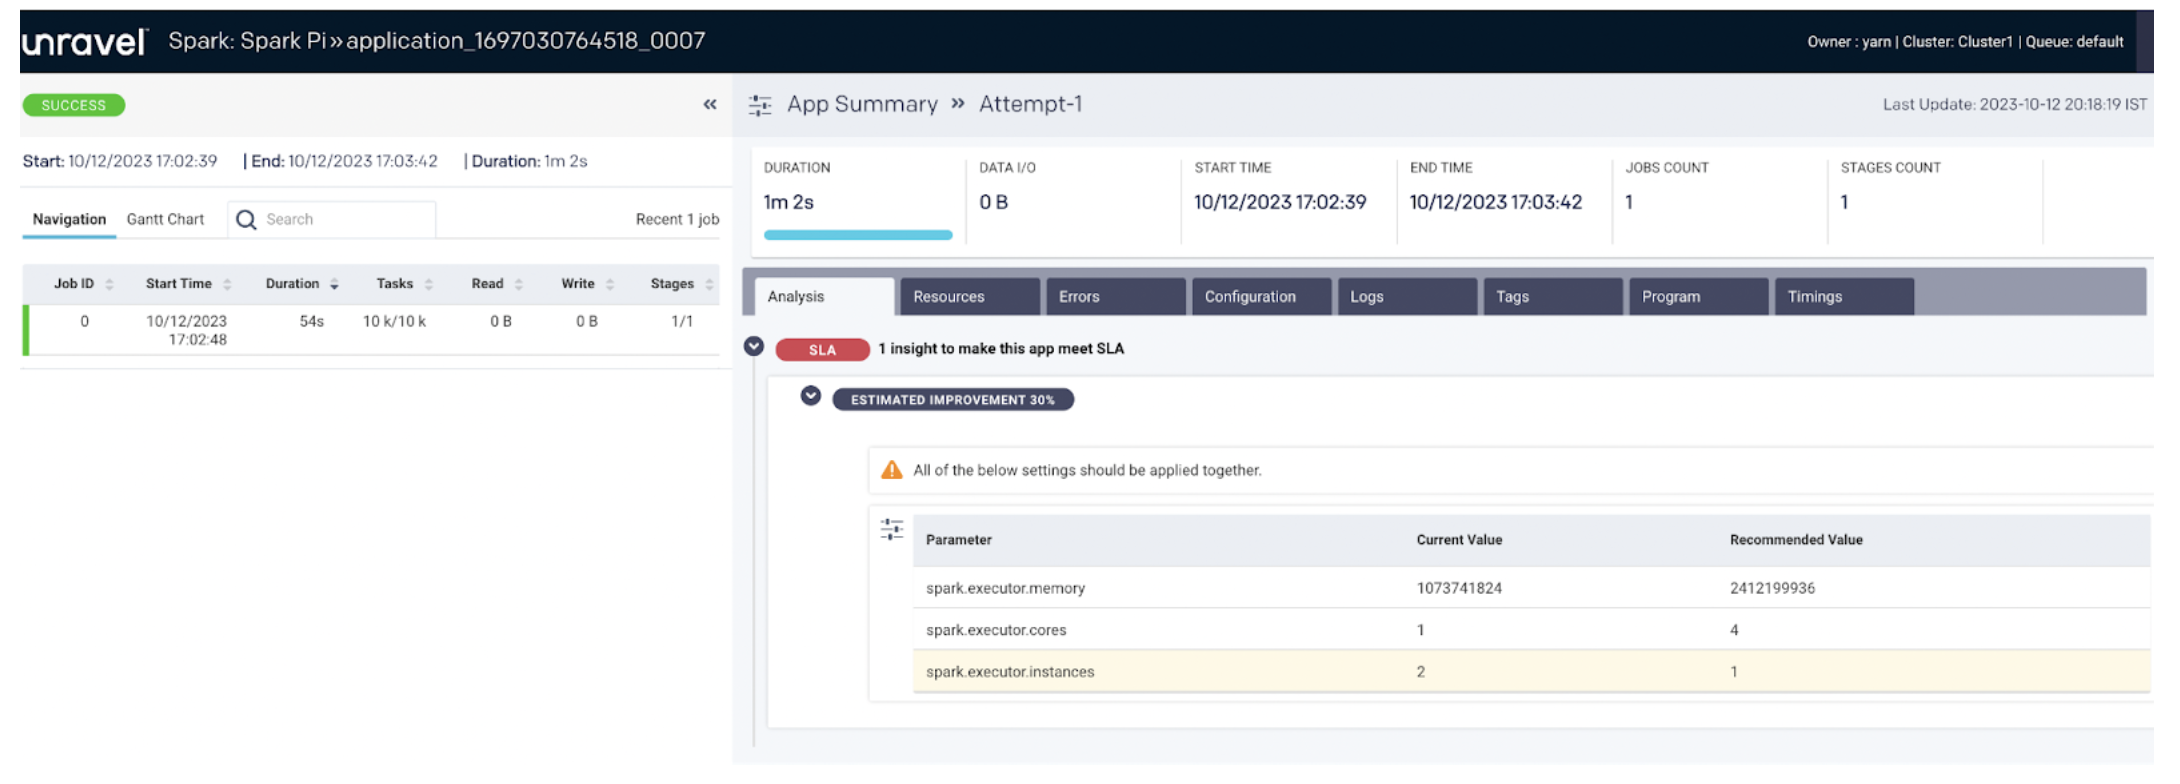
Here we have more detail about the Spark job and the Spark ID created during the DAG run that helps verify the list of Spark jobs, understand which DAG run created the specific Spark job, see the resources consumed by that Spark job, or find out the configuration of the Spark job.
Tracking down a specific Spark job from a DAG run is difficult since although Airflow initiates the task run, Spark takes care of running the task. Unravel can monitor and collect details from Spark, identify the Spark ID, and correlate the Spark job to the Airflow DAG run that initiated the job.
Take tour
Delay in Scheduling Pipeline Run
Unravel helps pinpoint the delay in scheduling DAG runs.
The same financial services company runs multiple DAGs as part of their pipeline system. While the DAG runs are working fine, the team stumbles upon a different problem: the DAG that is expected to run at the scheduled time is running at a delayed time. This delay affects running subsequent DAG runs, resulting in tasks not getting completed on time.
Airflow has the capability to alert if a Task/DAG that’s running misses its SLA. But there are cases when the DAG run is not initiated at all in the first place—e.g., no slot is available or the number of DAGs that can run in parallel exceeds the configured maximum number.
Unravel helps bring the problem to the surface by rendering underlying details about the DAG run delay right in the UI. For a DAG run ID, Unravel shows the useful information collected from StatsD like the total parse time for processing the DAG, DAG run schedule delay, etc. This information provides pipeline insights that help to identify why there is delay in scheduling the DAG run around the DAG execution time.
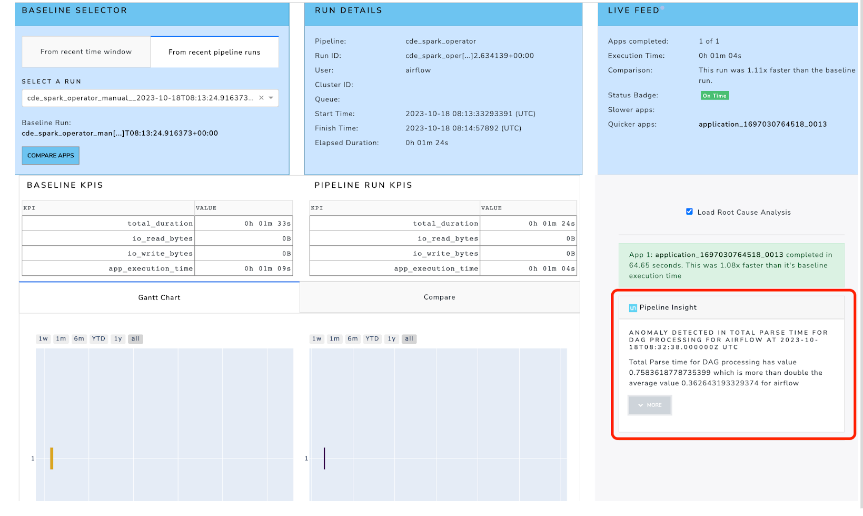
The Pipeline Details page presents DAG run ID information, with pipeline insights about the schedule delay in the right-hand pane. It clearly shows that the DAG run was delayed well beyond the acceptable threshold.
Unravel helps keep the pipeline running in check and automatically delivers insights about what’s happening inside Airflow. Unravel monitors systems like Spark, BigQuery, and Airflow and has the granular data about each of the systems, connecting that information and rendering the right insights to make it a powerful tool for monitoring cloud data systems.
Take tour