

Table of Contents
Current practice for Spark troubleshooting is messy. Part of this is due to Spark’s very popularity; it’s widely used on platforms as varied as open source Apache Spark, on all platforms; Cloudera’s Hadoop offerings (on-premises and in the cloud); Amazon EMR, Azure Synapse, and Google Dataproc; and Databricks, which runs on all three public clouds. (Which means you have to be able to address Spark’s interaction with all of these very different environments.)
Because Spark does so much, on so many platforms, “Spark troubleshooting” covers a wide range of problems – jobs that halt; pipelines that fail to deliver, so you have to find the issue; performance that’s too slow; or using too many resources, either in the data center (where your clusters can suck up all available resources) or in the cloud (where resources are always available, but your costs rise, or even skyrocket.)
Where Are the Issues – and the Solutions?
Problems in running Spark jobs occur at the job and pipeline levels, as well as at the cluster level, as described in Part 1 of this three-part series: the top ten problems you encounter in working with Spark. And there are several solutions that can help, as we described in Part 2: five types of solutions used for Spark troubleshooting. (You can also see our recent webinar, Troubleshooting Apache Spark, for an overview and demo.)
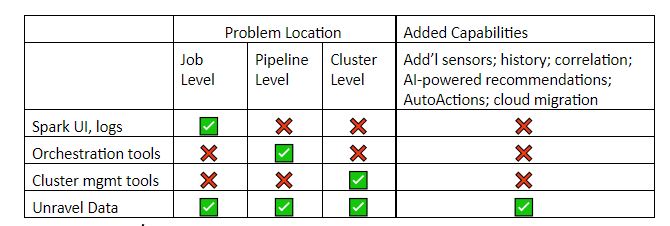
Table: What each level of tool shows you – and what’s missing
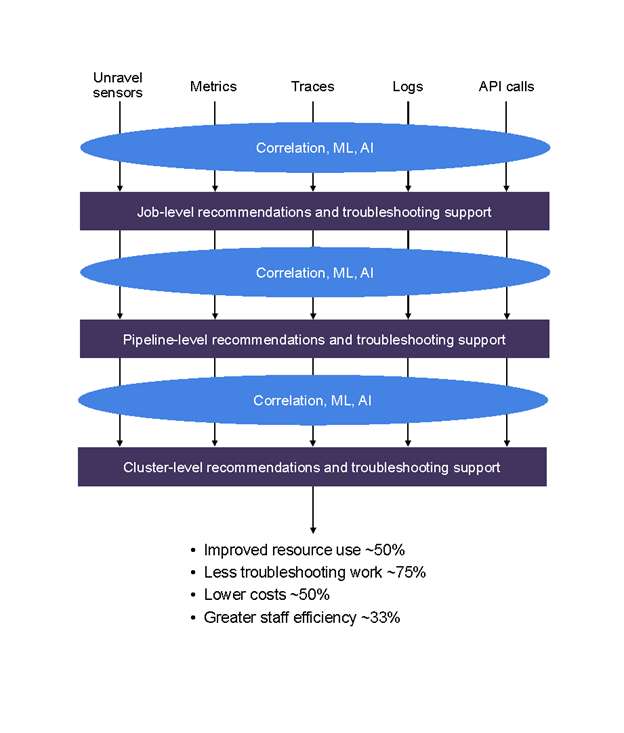
Existing tools provide incomplete, siloed information. We created Unravel Data as a go-to DataOps platform that includes much of the best of existing tools. In this blog post we’ll give examples of problems at the job, pipeline, and cluster levels, and show how to solve them with Unravel Data. We’ll also briefly describe how Unravel Data helps you prevent problems, providing AI-powered, proactive recommendations.
The Unravel Data platform gathers more information than existing tools by adding its own sensors to your stack, and by using all previously existing metrics, traces, logs, and available API calls. It gathers this robust information set together and correlates pipeline information, for example, across jobs.
The types of issues that Unravel covers are, broadly speaking: fixing bottlenecks; meeting and beating SLAs; cost optimization; fixing failures; and addressing slowdowns, helping you improve performance. Within each of these broad areas, Unravel has the ability to spot hundreds of different types of factors contributing to an issue. These contributing factors include data skew, bad joins, load imbalance, incorrectly sized containers, poor configuration settings, and poorly written code, as well as a variety of other issues.
Fixing Job-Level Problems with Unravel
Here’s an example of a Spark job or application run that’s monitored by Unravel.
In Unravel, you first see automatic recommendations, analysis, and insights for any given job. This allows users to quickly understand what the problem is, why it happened, and how to resolve it. In the example below, resolving the problem will take about a minute.
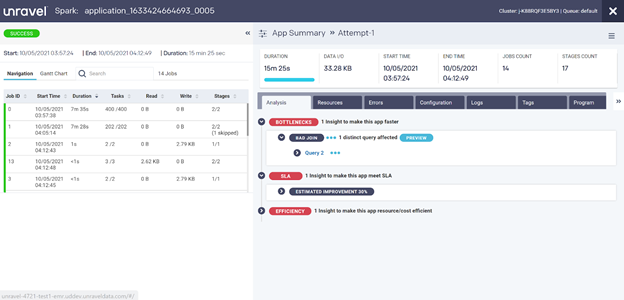
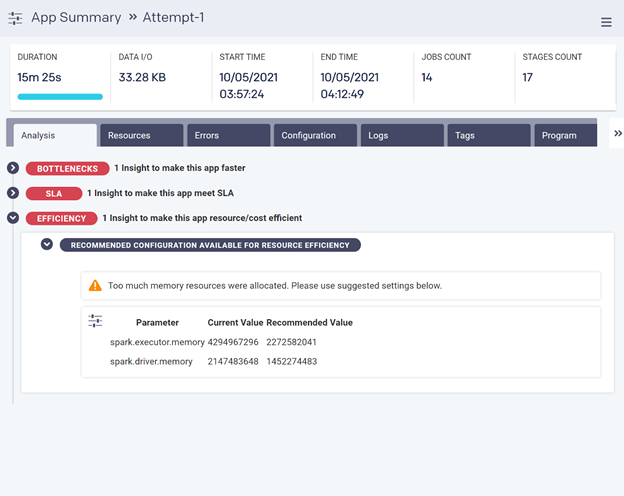
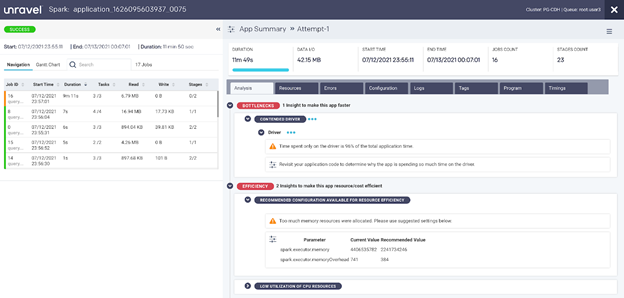
Let’s dive into the insights for an application run, as shown below.
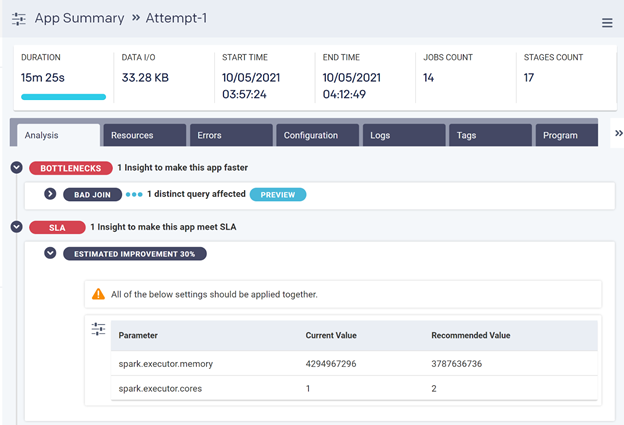
You can see here that Unravel has spotted bottlenecks, and also room for improving the performance of this app. It has narrowed down what the particular problem is with this application and how to resolve it. In this case, it has recommended to double the number of executors and reduce the memory for each executor, which will improve performance by about 30%, meeting the SLA.
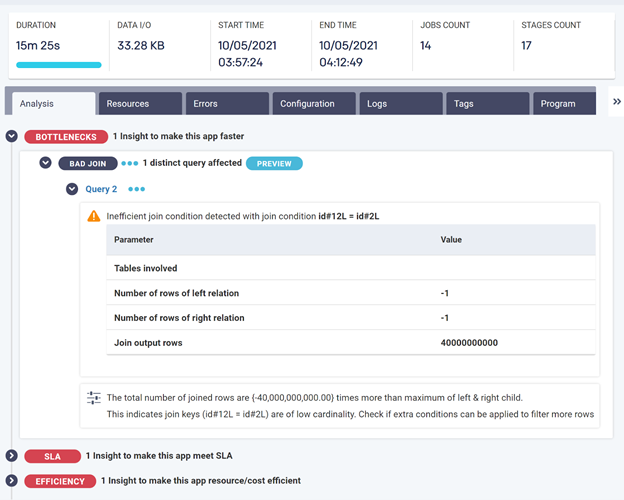
Additionally, Unravel has also spotted some bad joins which are slowing this application down, as shown below.
 In addition to helping speed this application up, Unravel is also recommending resource settings which will lower the cost of running this application, as shown below – reductions of roughly 50% in executor memory and driver memory, cutting out half the total memory cost. Again, Unravel is delivering pinpoint recommendations. Users avoid a lengthy trial-and-error exercise; instead, they can solve the problem in about a minute.
 Unravel can also help with jobs or applications that just didn’t work and failed. It uses a similar approach as above to help data engineers and operators get to the root cause of the problem and resolve it quickly.
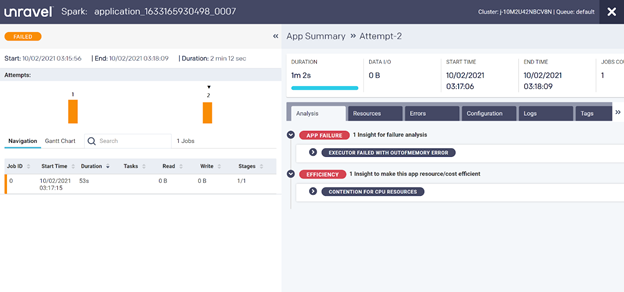
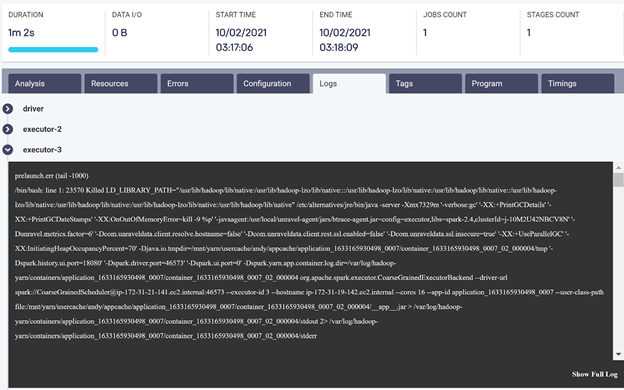
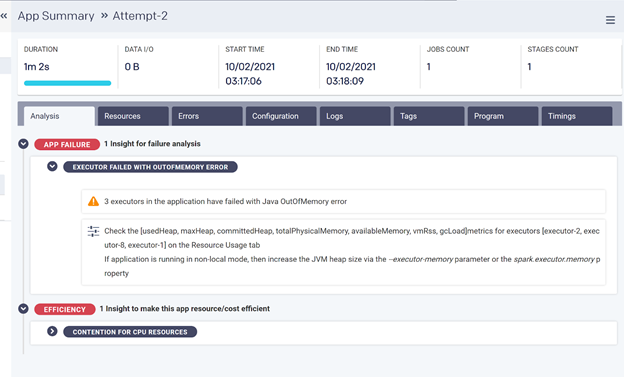 In this example, the job or application failed because of an out of memory exception error. Unravel surfaces this problem instantly and pinpoints exactly where the problem is.
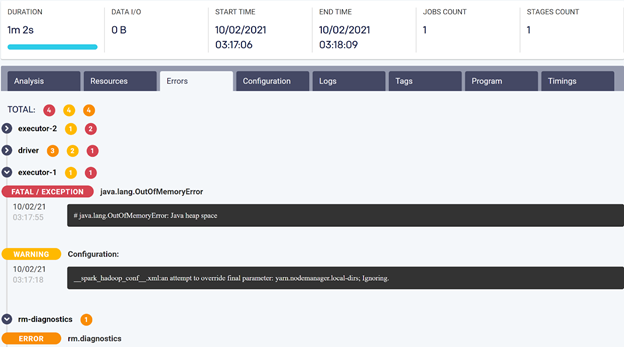
For further information, and to support investigation, Unravel provides distilled and easy-to-access logs and error messages, so users and data engineers have all the relevant information they need at hand.
And once data teams start using Unravel, they can do everything with more confidence. For instance, if they try to save money by keeping resource allocations low, but overdo that a little bit, they’ll get an out-of-memory error. Previously, it might have taken many hours to resolve the error, so the team might not risk tight allocations. But fixing the error only takes a couple of minutes with Unravel, so the data team can cut costs effectively.
Examples of logs that Unravel provides for easy access and error message screens follow.
Unravel strives to help users solve their problems with a click of a button. At the same time, Unravel provides a great deal of detail about each job and application, including displaying code execution, displaying DAGs, showing resource usage, tracking task execution, and more. This allows users to drill down to whatever depth needed to understand and solve the problem.
Task stage metrics in Unravel Data
As another example, this screen shows details for task stage information:
- Left-hand side: task metrics. This includes the job stage task metrics of Spark, much like what you would see from Spark UI. However, Unravel keeps history on this information; stores critical log information for easy access; presents multiple logs coherently; and ties problems to specific log locations.
- Right-hand side: holistic KPIs. Information such as job start and end time, run-time durations, I/O in KB – and whether each job succeeded or failed.
Data Pipeline Problems
The tools people use for troubleshooting Spark jobs tend to focus on one level of the stack or another – the networking level, the cluster level, or the job level, for instance. None of these approaches helps much with Spark pipelines. A pipeline is likely to have many stages, involving many separate Spark jobs.
Here’s an example. One Spark job can handle data ingest; a second job, transformation; a third job may send the data to Kafka; and a final job can be reading the data from Kafka and then putting it into a distributed store, like Amazon S3 or HDFS.
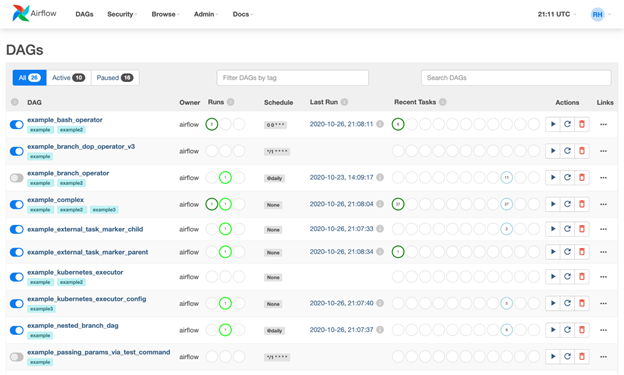
Airflow being used to create and organize a Spark pipeline.
The two most important orchestration tools are Oozie, which tends to be used with on-premises Hadoop, and Airflow, which is used more often in the cloud. They will help you create and manage a pipeline; and, when the pipeline breaks down, they’ll show you which job the problem occurred in.
But orchestration tools don’t help you drill down into that job; that’s up to you. You have to find the specific Spark run where the failure occurred. You have to use other tools, such as Spark UI or logs, and look at timestamps, using your detailed knowledge of each job to cross-correlate and, hopefully, find the issue. As you see, just finding the problem is messy, intense, time-consuming, expert work; fixing it is even more effort.
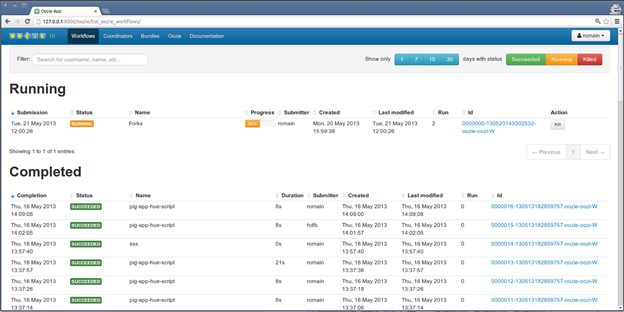
Oozie also gives you a big-picture view of pipelines.
Unravel, by contrast, provides pipeline-specific views that first connect all the components – Spark, and everything else in your modern data stack – and runs of the data pipeline together in one place. Unravel then allows you to drill down into the slow, failed, or inefficient job, identify the actual problem, and fix it quickly. And it gets even better; Unravel’s AI-powered recommendations will help you prevent a pipeline problem from even happening in the first place.
You didn’t have to look at Spark UI, plus dig through Spark logs, then check Oozie or Airflow. All the information is correlated into one view – a single pane of glass.
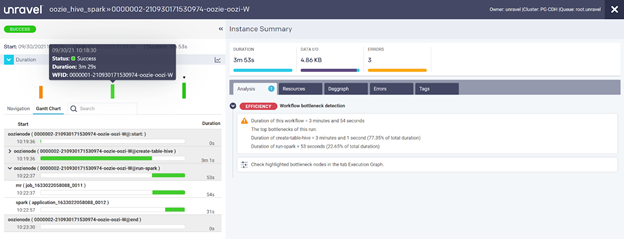
This view shows details for several jobs. In the graphic, each line has an instance run. The longest duration shown here is three minutes and 1 second. If the SLA is “under two minutes,” then the job failed to meet its SLA. (Because some jobs run scores or hundreds of times a day, missing an SLA by more than a minute – especially when that means a roughly 50% overshoot against the SLA – can become a very big deal.)
Unravel then provides history and correlated information, using all of this to deliver AI-powered recommendations. You can also set AutoActions against a wide variety of conditions and get cloud migration support.
Cluster Issues
Resources are allocated at the cluster level. The screenshot shows ResourceManager (RM), which tracks resources, schedules jobs such as Spark jobs, and so on. You can see the virtual machines assigned to your Spark jobs, what resources they’re using, and status – started or not started, completed or not completed.
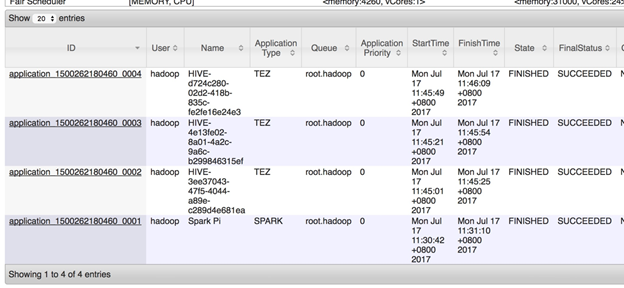
Apache Hadoop ResourceManager
The first problem is that there’s no way to see what actual resources your job is consuming. Nor can you see whether those resources are being used efficiently or not. So you can be over-allocated, wasting resources – or running very close to your resources limit, with the job likely to crash in the future.
Nor can you compare past to present; ResourceManager does not have history in it. Now you can pull logs at this level – the YARN level – to look at what was happening, but that’s aggregated data, not the detail you’re looking for. You also can’t dig into potential conflicts with neighbors sharing resources in the cluster.
You can use site tools like Cloudwatch, Cloudera Manager or Ambari. They provide a useful holistic view, at the cluster level – total CPU consumption, disk I/O consumption, and network I/O consumption. But, as with some of the pipeline views we discussed above, you can’t take this down to the job level.
You may have a spike in cluster disk I/O. Was it your job that started that, or someone else’s? Again, you’re looking at Spark UI, you’re looking at Spark logs, hoping maybe to get a bit lucky and figure out what the problem is. Troubleshooting becomes a huge intellectual and practical challenge. And this is all taking away from time making your environment better or doing new projects that move the business forward.
It’s common for a job to be submitted, then held because the cluster’s resources are already tied up. The bigger the job, the more likely it will have to wait. But existing tools make it hard to see how busy the cluster is. So later, when the job that had to wait finishes late, no one knows why that happened.
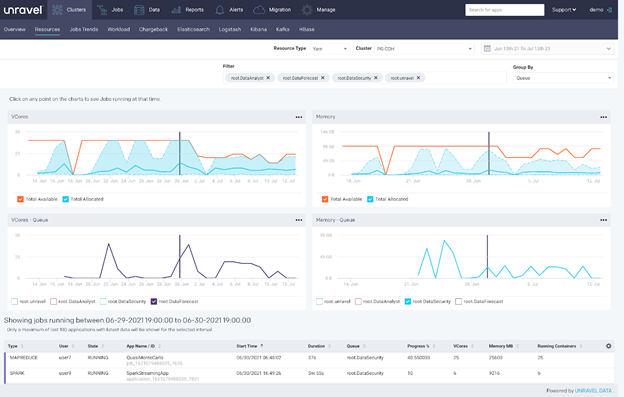
A cluster-level view showing vCores, specific users, and a specific queue
By contrast, in this screenshot from Unravel, you see cluster-level details. This job was in the data security queue, and it was submitted on July 5th, around 7:30pm. These two rows show vCores – overall consumption on this Hadoop cluster’s memory. The orange line shows maximum usage, and the blue line shows what’s available.
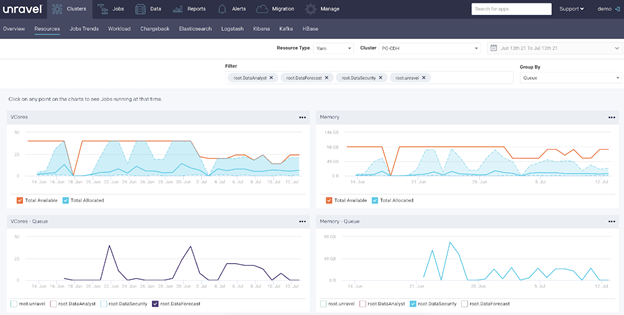
At this point in time, usage (blue line) did not exceed available resources (orange line)
You can also get more granular and look at a specific user. You can go to the date and time that the job was launched and see what was running at that point in time. And voilà – there were actually enough resources available.
So it’s not a cluster-level problem; you need to examine the job itself. And Unravel, as we’ve described, gives you the tools to do that. You can see that we’ve eliminated a whole class of potential problems for this slowdown – not in hours or days, and with no trial-and-error experimentation needed. We just clicked around in Unravel for a few minutes.
Unravel Data: An Ounce of Prevention
For the issues above, such as slowdowns, failures, missed SLAs or just expensive runs, a developer would have to be looking at YARN logs, ResourceManager logs, and Spark logs, possibly spending hours figuring it all out. Within Unravel, though, they would not need to jump between all those screens; they would get all the information in one place. They can then use Unravel’s built-in intelligence to automatically root-cause the problem and resolve it.
Unravel Data solves the problem of Spark troubleshooting at all three levels – at the job, pipeline, and cluster levels. It handles the correlation problem – tying together cluster, pipeline, and job information – for you. Then it uses that information to give unique views at every level of your environment. Unravel makes AI-powered recommendations to help you head off problems; allows you to create AutoActions that execute on triggers you define; and makes troubleshooting much easier.
Unravel solves systemic problems with Spark. For instance, Spark tends to cause overallocation: assigning very large amounts of resources to every run of a Spark job, to try to avoid crashes on any run of that job over time. The biggest datasets or most congested conditions set the tone for all runs of the job or pipeline. But with Unravel, you can flexibly right-size the allocation of resources.
Unravel frees up your experts to do more productive work. And Unravel often enables newer and more junior-level people to be as effective as an expert would have been, using the ability to drill down, and the proactive insights and recommendations that Unravel provides.
Unravel even feeds back into software development. Once you find problems, you can work with the development team to implement new best practices, heading off problems before they appear. Unravel will then quickly tell you which new or revised jobs are making the grade.
The Unravel advantage – on-premises and all public clouds
Another hidden virtue of Unravel is: it serves as a single source of truth for different roles in the organization. If the developer, or an operations person, finds a problem, then they can use Unravel to highlight just what the issue is, and how to fix it. And not only how to fix it this time, for this job, but to reduce the incidence of that class of problem across the whole organization. The same goes for business intelligence (BI) tool users such as analysts, data scientists, everyone. Unravel gives you a kind of X-ray of problems, so you can cooperate in solving them.
With Unravel, you have the job history, the cluster history, and the interaction with the environment as a whole – whether it be on-premises, or using Databricks or native services on AWS, Azure, or Google Cloud Platform. In most cases you don’t have to try to remember, or discover, what tools you might have available in a given environment. You just click around in Unravel, largely the same way in any environment, and solve your problem.
Between the problems you avoid, and your new-found ability to quickly solve the problems that do arise, you can start meeting your SLAs in a resource-efficient manner. You can create your jobs, run them, and be a rockstar Spark developer or operations person within your organization.
Conclusion
In this blog post, we’ve given you a wide-ranging tour of how you can use Unravel Data to troubleshoot Spark jobs – on-premises and in the cloud, at the job, pipeline, and cluster levels, working across all levels, efficiently, from a single pane of glass.
In Troubleshooting Spark Applications, Part 1: Ten Challenges, we described the ten biggest challenges for troubleshooting Spark jobs across levels. And in Spark Troubleshooting, Part 2: Five Types of Solutions, we describe the major categories of tools, several of which we touched on here.
This blog post, Part 3, builds on the other two to show you how to address the problems we described, and more, with a single tool that does the best of what single-purpose tools do, and more – our DataOps platform, Unravel Data.