

Table of Contents
Apache Spark is the leading technology for big data processing, on-premises and in the cloud. Spark powers advanced analytics, AI, machine learning, and more. Spark provides a unified infrastructure for all kinds of professionals to work together to achieve outstanding results.
Technologies such as Cloudera’s offerings, Amazon EMR, and Databricks are largely used to run Spark jobs. However, as Spark’s importance grows, so does the importance of Spark reliability – and troubleshooting Spark problems is hard. Information you need for troubleshooting is scattered across multiple, voluminous log files. The right log files can be hard to find, and even harder to understand. There are other tools, each providing part of the picture, leaving it to you to try to assemble the jigsaw puzzle yourself.
Would your organization benefit from rapid troubleshooting for your Spark workloads? If you’re running significant workloads on Spark, then you may be looking for ways to find and fix problems faster and better – and to find new approaches that steadily reduce your problems over time.
This blog post is adapted from the recent webinar, Troubleshooting Apache Spark, part of the Unravel Data “Optimize” Webinar Series. In the webinar, Unravel Data’s Global Director of Solutions Engineering, Chis Santiago, runs through common challenges faced when troubleshooting Spark and shows how Unravel Data can help.
Spark: The Good, the Bad & the Ugly
Chris has been at Unravel for almost four years. Throughout that time, when it comes to Spark, he has seen it all – the good, the bad, and the ugly. On one hand, Spark as a community has been growing exponentially. Millions of users are adopting Spark, with no end in sight. Cloud platforms such as Amazon EMR and Databricks are largely used to run Spark jobs.
Spark is here to stay, and use cases are rising. There are countless product innovations powered by Spark, such as Netflix recommendations, targeted ads on Facebook and Instagram, or the “Trending” feature on Twitter. On top of its great power, the barrier to entry for Spark is now lower than ever before. But unfortunately, with the good comes the bad, and the number one common issue is troubleshooting.
Troubleshooting Spark is complex for a multitude of different reasons. First off, there are multiple points of failure. A typical Spark data pipeline could be using orchestration tools, such as Airflow or Oozie, as well as built-in tools, such as Spark UI. You also may be using cluster management technologies, such as Cluster Manager or Ambari.
A failure may not always start on Spark; it could rather be a failure within a network layer on the cloud, for example.
Because Spark uses so many tools, not only does that introduce multiple points of failure, but there is also a lot of correlating information from various sources that you must carry out across these platforms. This requires expertise. You need experience in order to understand not only the basics of Spark, but all the other platforms that can support Spark as well.
Lastly, when running Spark workloads, the priority is often to meet SLAs at all costs. To meet SLAs you may, for example, double your resources, but there will always be a downstream effect. Determining what’s an appropriate action to take in order to make SLAs can be tricky.
Unlock your data environment health with a free health check.
The Three Levels of Spark Troubleshooting
There are multiple levels when it comes to troubleshooting Spark. First there is the Job Level, which deals with the inner workings of Spark itself, from executors to drivers to memory allocation to logs. The job level is about determining best practices for using the tools that we have today to make sure that Spark jobs are performing properly. Next is the Pipeline Level. Troubleshooting at the pipeline level is about managing multiple Spark runs and stages to make sure you’re getting in front of issues and using different tools to your advantage. Lasty, there is the Cluster Level, which deals with infrastructure. Troubleshooting at the cluster level is about understanding the platform in order to get an end-to-end view of troubleshooting Spark jobs.
Troubleshooting: Job Level
A Spark job refers to actions such as doing work in a workbook or analyzing a Spark SQL query. One tool used on the Spark job level is Spark UI. Spark UI can be described as an interface for understanding Spark at the job level.
Spark UI is useful in giving granular details about the breakdown of tasks, breakdown of stages, the amount of time it takes workers to complete tasks, etc. Spark UI is a powerful dataset that you can use to understand every detail about what happened to a particular Spark job.
Challenges people often face are manual correlation; understanding the overall architecture of Spark; and, more importantly, things such as understanding what logs you need to look into and how one job correlates with other jobs. While Spark UI is the default starting point to determine what is going on with Spark jobs, there is still a lot of interpretation that needs to be done, which takes experience.
Further expanding on Spark job-level challenges, one thing people often face difficulty with is diving into the logs. If you truly want to understand what caused a job to fail, you must get down to the log details. However, looking at logs is the most verbose way of troubleshooting, because every component in Spark produces logs. Therefore, you have to look at a lot of errors and timestamps across multiple servers. Looking at logs gives you the most information to help understand why a job has failed, but sifting through all that information is time-consuming.
It also may be challenging to determine where to start on the job level. Spark was born out of the Hadoop ecosystem, so it has a lot of big data concepts. If you’re not familiar with big data concepts, determining a starting point may be difficult. Understanding the concepts behind Spark takes time, effort, and experience.
Lastly, when it comes to Spark jobs, there are often multiple job runs that make up a data pipeline. Figuring out how one Spark job affects another is tricky and must be done manually. In his experience working with the best engineers at large organizations, Chris finds that even they sometimes decide not to finish troubleshooting, and instead just keep on running and re-running a job until it’s completed or meets the SLA. While troubleshooting is ideal, it is extremely time-consuming. Therefore, having a better tool for troubleshooting on the job level would be helpful.
Troubleshooting: Pipeline Level
In Chris’ experience, most organizations don’t have just one Spark job that does everything, but there are rather multiple stages and jobs that are needed to carry out Spark workloads. To manage all these steps and jobs you’d need an orchestration tool. One popular orchestration tool is Airflow, which allows you to sequence out specific jobs.
Orchestration tools like Airflow are useful in managing pipelines. But while these tools are helpful for creating complex pipelines and mapping where points of failure are, they are lacking when it comes to providing detailed information about why a specific step may have failed. Orchestration tools are more focused on the higher, orchestration level, rather than the Spark job level. Orchestration tools tell you where and when something has failed, so they are useful as a starting point to troubleshoot data pipeline jobs on Spark.
Those who are running Spark on Hadoop, however, often use Oozie. Similarly to Airflow, Oozie gives you a high level view, alerting you when a job has failed, but not providing the type of information needed to answer questions such as “Where is the bottleneck?” or “Why did the job break down?”. To answer these questions, it’s up to the user to manually correlate the information that orchestration tools provide with information from job-level tools, which again requires expertise. For example, you may have to determine which Spark run that you see in Spark UI correlates to a certain step in Airflow. This can be very time consuming and prone to errors.
Troubleshooting: Cluster Level
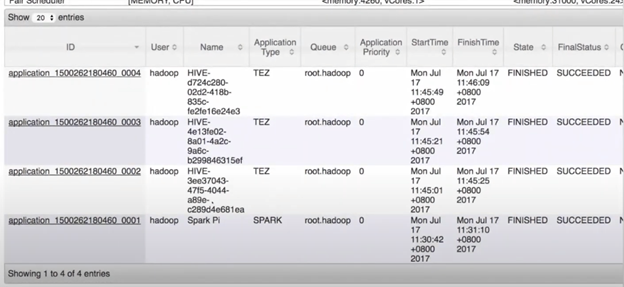
The cluster level for Spark is the level that refers to things such as infrastructure, VMs, allocated resources, and Hadoop. Hadoop’s ResourceManager is a great tool for managing applications as they come in. ResourceManage is also useful for determining what the resource usage is, and where a Spark job is in the queue.
However, one shortcoming of ResourceManager is that you don’t get historical data. You cannot view the past state of ResourceManager from twelve or twenty-four hours ago, for example. Everytime you open ResourceManager you have a view of how jobs are consuming resources at that specific time, as shown below.
Another challenge when troubleshooting Spark on the cluster level is that while tools such as Cluster Manager or Ambari give a holistic view of what’s going on with the entire estate, you cannot see how cluster-level information, such as CPU consumption, I/O consumption, or network I/O consumption, relate to Spark jobs.
Lastly, and similarly to the challenges faced when troubleshooting on the job and pipeline level, manual correlation is also a problem when it comes to troubleshooting on the cluster level. Manual correlation takes time and effort that a data science team could instead be putting towards product innovations.
But what if there was a tool that takes all these troubleshooting challenges, on the job, pipeline, and cluster level, into consideration? Well, luckily, Unravel Data does just that. Chris next gives examples of how Unravel can be used to mitigate Spark troubleshooting issues, which we’ll go over in the remainder of this blog post.
Unlock your data environment health with a free health check.
Demo: Unravel for Spark Troubleshooting
The beauty of Unravel is that it provides a single pane of glass where you can look at logs, the type of information provided by Spark UI, Oozie, and all the other tools mentioned throughout this blog, and data uniquely available through Unravel, all in one view. At this point in the webinar, Chris takes us through a demo to show how Unravel aids in troubleshooting at all Spark levels – job, pipeline, and cluster. For a deeper dive into the demo, view the webinar.
Job Level
At the job level, one area where Unravel can be leveraged is in determining why a job failed. The image below is a Spark run that is monitored by Unravel.
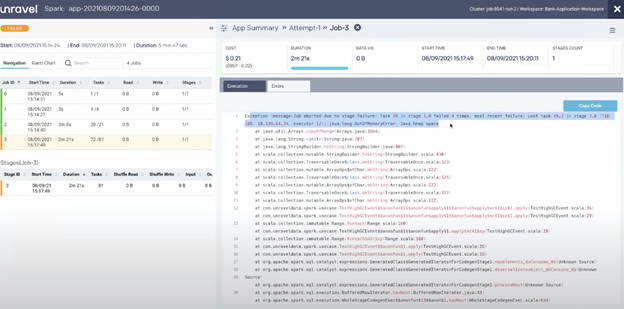
On the left hand side of the dashboard, you can see that Job 3 has failed, indicated by the orange bar. With Unravel, you can click on the failed job and see what errors occurred. On the right side of the dashboard, within the Errors tab, you can see why Job 3 failed, as highlighted in blue. Unravel is showing the Spark logs that give information on the failure.
Pipeline Level
Using Unravel for troubleshooting at the data pipeline level, you can look at a specific workflow, rather than looking at the specifics of one job. The image shows the dashboard when looking at data pipelines.
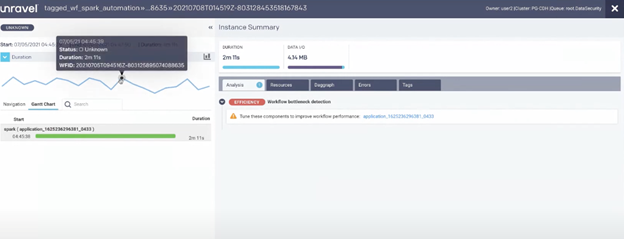
On the left, the blue lines represent instance runs. The black dot represents a job that ran for two minutes and eleven seconds. You could use information on run duration to determine if you meet your SLA. If your SLA is under two minutes, for example, the highlighted run would miss the SLA. With Unravel you can also look at changes in I/O, as well as dive deeper into specific jobs to determine why they lasted a certain amount of time. The information in the screenshot gives us insight into why the job mentioned prior ran for two minutes and eleven seconds.
The Unravel Analysis tab, shown above, carries out analysis to detect issues and make recommendations on how to mitigate those issues.
Cluster Level
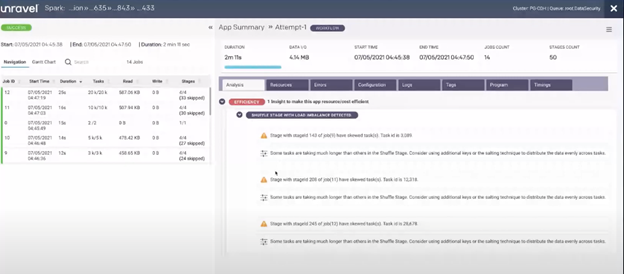
Below is the view of Unravel when troubleshooting at the cluster level, specifically focusing on the same job mentioned previously. The job, which again lasted two minutes and eleven seconds, took place on July 5th at around 7PM. So what happened?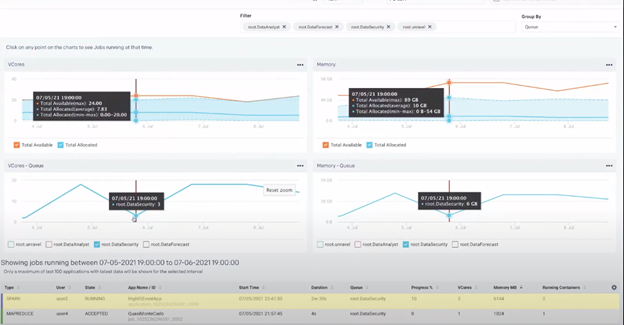
The image above shows information about the data security queue at the time when the job we’re interested in was running. The table at the bottom of the dashboard shows the state of the jobs that were running on July 5th at 7PM, allowing you to see which, if any, job was taking up too much resources. In this case, Chris’ job, highlighted in yellow, wasn’t using a large amount of resources. From there, Chris can then conclude that perhaps the issue is instead on the application side and something needs to be fixed within the code. The best way to determine what needs to be fixed is to use the Analysis tab mentioned previously.
Conclusion
There are many ways to troubleshoot Spark, whether it be on the job, pipeline, or cluster level. Unravel can be your one-stop shop to determine what is going on with your Spark jobs and data pipelines, as well as give you proactive intelligence that allows you to quickly troubleshoot your jobs. Unravel can help you meet your SLAs in a resourceful and efficient manner.
If you want to know more about Unravel Data, you can get a free health check report to unlock your data environment or contact us.