

Introduction
In the era of Big Data, the importance of data quality cannot be overstated. The vast volumes of information generated every second hold immense potential for organizations across industries. However, this potential can only be realized when the underlying data is accurate, reliable, and consistent. Data quality serves as the bedrock upon which crucial business decisions are made, insights are derived, and strategies are formulated. It empowers organizations to gain a comprehensive understanding of their operations, customers, and market trends. High-quality data ensures that analytics, machine learning, and artificial intelligence algorithms produce meaningful and actionable outcomes. From detecting patterns and predicting trends to identifying opportunities and mitigating risks, data quality is the driving force behind data-driven success. It instills confidence in decision-makers, fosters innovation, and unlocks the full potential of Big Data, enabling organizations to thrive in today’s data-driven world.
Overview
In this seven-part blog we will explore using ML/AI for data quality. Machine learning and artificial intelligence can be instrumental in improving the quality of data. Machine learning models like logistic regression, decision trees, random forests, gradient boosting machines, and neural networks predict categories of data based on past examples, correcting misclassifications. Linear regression, polynomial regression, support vector regression, and neural networks predict numeric values, filling in missing entries. Clustering techniques like K-means, hierarchical clustering, and DBSCAN identify duplicates or near-duplicates. Models such as Isolation Forest, Local Outlier Factor, and Auto-encoders detect outliers and anomalies. To handle missing data, k-Nearest Neighbors and Expectation-Maximization predict and fill in the gaps. NLP models like BERT, GPT, and RoBERTa process and analyze text data, ensuring quality through tasks like entity recognition and sentiment analysis. CNNs fix errors in image data, while RNNs and Transformer models handle sequence data. The key to ensuring data quality with these models is a well-labeled and accurate training set. Without good training data, the models may learn to reproduce the errors present in the data. We will focus on using the following models to apply critical data quality to our lakehouse.
Machine learning and artificial intelligence can be instrumental in improving the quality of data. Here are a few models and techniques that can be used for various use cases:
- Classification Algorithms: Models such as logistic regression, decision trees, random forests, gradient boosting machines, or neural networks can be used to predict categories of data based on past examples. This can be especially useful in cases where data entries have been misclassified or improperly labeled.
- Regression Algorithms: Similarly, algorithms like linear regression, polynomial regression, or more complex techniques like support vector regression or neural networks can predict numeric values in the data set. This can be beneficial for filling in missing numeric values in a data set.
- Clustering Algorithms: Techniques like K-means clustering, hierarchical clustering, or DBSCAN can be used to identify similar entries in a data set. This can help identify duplicates or near-duplicates in the data.
- Anomaly Detection Algorithms: Models like Isolation Forest, Local Outlier Factor (LOF), or Auto-encoders can be used to detect outliers or anomalies in the data. This can be beneficial in identifying and handling outliers or errors in the data set.
- Data Imputation Techniques: Missing data is a common problem in many data sets. Machine learning techniques, such as k-Nearest Neighbors (KNN) or Expectation-Maximization (EM), can be used to predict and fill in missing data.
- Natural Language Processing (NLP): NLP models like BERT, GPT, or RoBERTa can be used to process and analyze text data. These models can handle tasks such as entity recognition, sentiment analysis, text classification, which can be helpful in ensuring the quality of text data.
- Deep Learning Techniques: Convolutional Neural Networks (CNNs) can be used for image data to identify and correct errors, while Recurrent Neural Networks (RNNs) or Transformer models can be useful for sequence data.
Remember that the key to ensuring data quality with these models is a well-labeled and accurate training set. Without good training data, the models may learn to reproduce the errors presented in the data.
In this first blog of seven we will focus on Classification Algorithms. The code examples provided below can be found in this GitHub location. Below is a simple example of using a classification algorithm in a Databricks Notebook to address a data quality issue using a classification algorithm.
Data Engineers Leveraging AI/ML for Data Quality
Machine learning (ML) and artificial intelligence (AI) play a crucial role in the field of data engineering. Data engineers leverage ML and AI techniques to process, analyze, and extract valuable insights from large and complex datasets. Overall, ML and AI provide data engineers with powerful tools and techniques to extract insights, improve data quality, automate processes, and enable data-driven decision-making. They enhance the efficiency and effectiveness of data engineering workflows, enabling organizations to unlock the full potential of their data assets.
AI/ML can help with numerous data quality use cases. Models such as logistic regression, decision trees, random forests, gradient boosting machines, or neural networks can be used to predict categories of data based on past examples. This can be especially useful in cases where data entries have been misclassified or improperly labeled. Similarly, algorithms like linear regression, polynomial regression, or more complex techniques like support vector regression or neural networks can predict numeric values in the data set. This can be beneficial for filling in missing numeric values in a data set. Techniques like K-means clustering, hierarchical clustering, or DBSCAN can be used to identify similar entries in a data set. This can help identify duplicates or near-duplicates in the data. Models like Isolation Forest, Local Outlier Factor (LOF), or Auto-encoders can be used to detect outliers or anomalies in the data. This can be beneficial in identifying and handling outliers or errors in the data set.
Missing data is a common problem in many data sets. Machine learning techniques, such as k-Nearest Neighbors (KNN) or Expectation-Maximization (EM), can be used to predict and fill in missing data. NLP models like BERT, GPT, or RoBERTa can be used to process and analyze text data. These models can handle tasks such as entity recognition, sentiment analysis, text classification, which can be helpful in ensuring the quality of text data. Convolutional Neural Networks (CNNs) can be used for image data to identify and correct errors, while Recurrent Neural Networks (RNNs) or Transformer models can be useful for sequence data.
Suppose we have a dataset with some missing categorical values. We can use logistic regression to fill in the missing values based on the other features. For the purpose of this example, let’s assume we have a dataset with ‘age’, ‘income’, and ‘job_type’ features. Suppose ‘job_type’ is a categorical variable with some missing entries.
Classification Algorithms — Using Logistic Regression to Fix the Data
Logistic regression is primarily used for binary classification problems, where the goal is to predict a binary outcome variable based on one or more input variables. However, it is not typically used directly for assessing data quality. Data quality refers to the accuracy, completeness, consistency, and reliability of data.
That being said, logistic regression can be indirectly used as a tool for identifying potential data quality issues. Here are some examples of how it can be used in data quality. Logistic regression can be used to define the specific data quality issue to be addressed. For example, you may be interested in identifying data records with missing values or outliers. Logistic regression can be used for feature engineering. This helps identify relevant features (variables) that may indicate the presence of the data quality issue. Data preparation is one of the most common uses of logistic regression. Here the ML helps prepare the dataset by cleaning, transforming, and normalizing the data as necessary. This step involves handling missing values, outliers, and any other data preprocessing tasks.
It’s important to note that logistic regression alone generally cannot fix data quality problems, but it can help identify potential issues by predicting their presence based on the available features. Addressing the identified data quality issues usually requires domain knowledge, data cleansing techniques, and appropriate data management processes. In the simplified example below we see a problem and then use logistic regression to predict what the missing values should be.
Step 1
Create a table with the columns “age”, “income”, and “job_type” in a SQL database, you can use the following SQL statement:
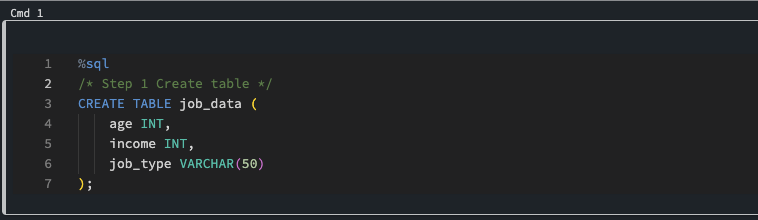
Step1: Create Table
Step 2
Load data to table. Notice that three records are missing job_type. This will be the column that we will use ML to predict. We load a very small set of data for this example. This same technique can be used against billions or trillions of rows. More data will almost always yield better results.
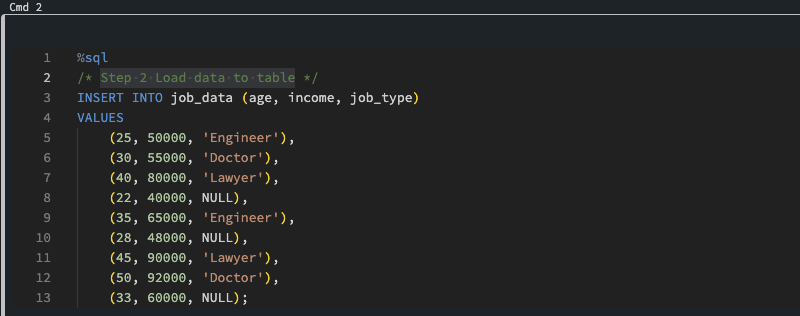
Step 2: Load Data to Table
Step 3
Load the data into a data frame. If you need to create a unique index for your data frame, please refer to this article.
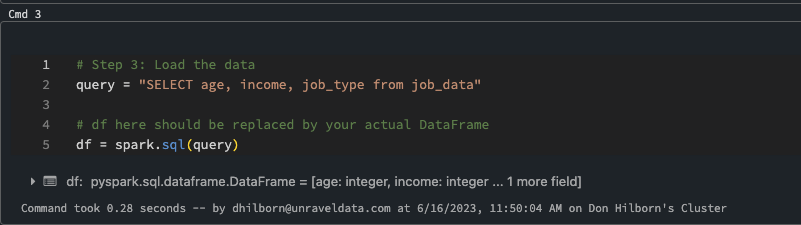
Step 3: Load Data to Data Frame
Step 4
In the context of PySpark DataFrame operations, filter() is a transformation function used to filter the rows in a DataFrame based on a condition.
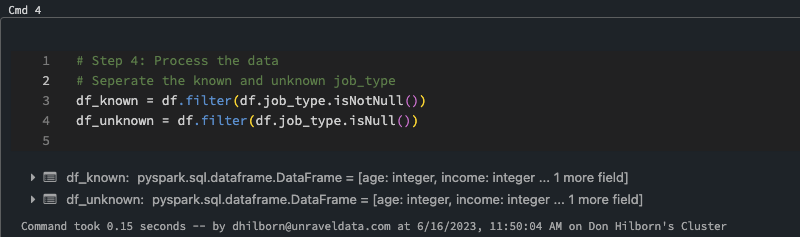
Step 4: Filter the Rows in a Data Frame Based on a Condition
df is the original DataFrame. We’re creating two new DataFrames, df_known and df_unknown, from this original DataFrame.
- df_known = df.filter(df.job_type.isNotNull()) is creating a new DataFrame that only contains rows where the job_type is not null (i.e., rows where the job_type is known).
- df_unknown = df.filter(df.job_type.isNull()) is creating a new DataFrame that only contains rows where the job_type is null (i.e., rows where the job_type is unknown).
By separating the known and unknown job_type rows into two separate DataFrames, we can perform different operations on each. For instance, we use df_known to train the machine learning model, and then use that model to predict the job_type for the df_unknown DataFrame.
Step 5
In this step we will vectorize the features. Vectorizing the features is a crucial pre-processing step in machine learning and AI. In the context of machine learning, vectorization refers to the process of converting raw data into a format that can be understood and processed by a machine learning algorithm. A vector is essentially an ordered list of values, which in machine learning represent the ‘features’ or attributes of an observation.
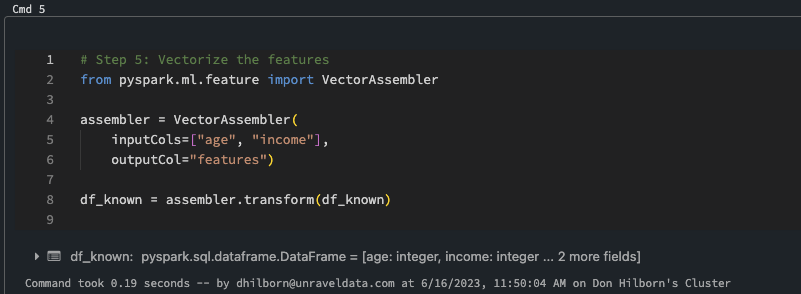
Step 5: Vectorize Features
Step 6
In this step we will convert categorical labels to indices. Converting categorical labels to indices is a common preprocessing step in ML and AI when dealing with categorical data. Categorical data represents information that is divided into distinct categories or classes, such as “red,” “blue,” and “green” for colors or “dog,” “cat,” and “bird” for animal types. Machine learning algorithms typically require numerical input, so converting categorical labels to indices allows these algorithms to process the data effectively.
Converting categorical labels to indices is important for ML and AI algorithms because it allows them to interpret and process the categorical data as numerical inputs. This conversion enables the algorithms to perform computations, calculate distances, and make predictions based on the numerical representations of the categories. It is worth noting that label encoding does not imply any inherent order or numerical relationship between the categories; it simply provides a numerical representation that algorithms can work with.
It’s also worth mentioning that in some cases, label encoding may not be sufficient, especially when the categorical data has a large number of unique categories or when there is no inherent ordinal relationship between the categories. In such cases, additional techniques like one-hot encoding or feature hashing may be used to represent categorical data effectively for ML and AI algorithms.
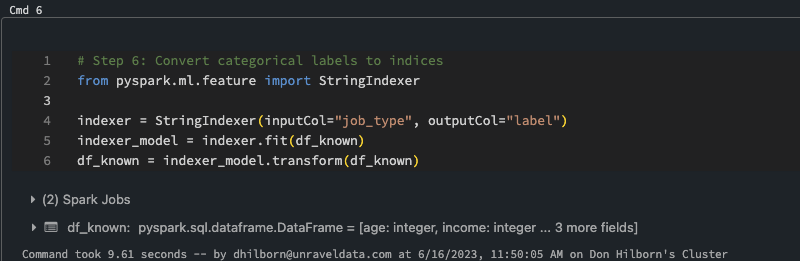
Step 6: Converting Categorical Labels to Indices
Step 7
In this step we will train the model. Training a logistic regression model involves the process of estimating the parameters of the model based on a given dataset. The goal is to find the best-fitting line or decision boundary that separates the different classes in the data.
The process of training a logistic regression model aims to find the optimal parameters that minimize the cost function and provide the best separation between classes in the given dataset. With the trained model, it becomes possible to make predictions on new data points and classify them into the appropriate class based on their features.
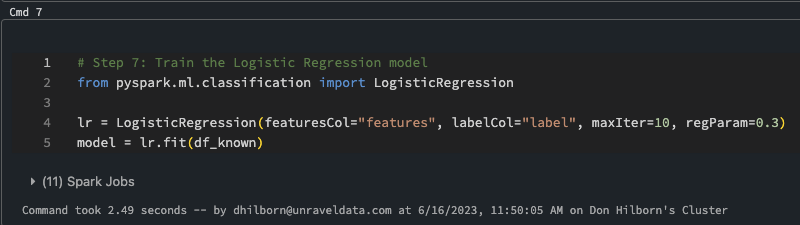
Step 7: Train the Model
Step 8
Predict the missing value in this case job_type. Logistic regression, despite its name, is a classification algorithm rather than a regression algorithm. It is used to predict the probability of an instance belonging to a particular class or category.
Logistic regression is widely used in various applications such as sentiment analysis, fraud detection, spam filtering, and medical diagnosis. It provides a probabilistic interpretation and flexibility in handling both numerical and categorical independent variables, making it a popular choice for classification tasks.
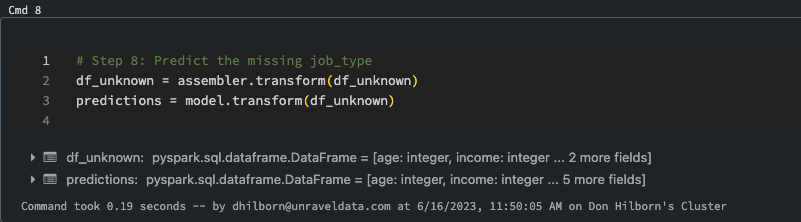
Step 8: Predict the Missing Value in This Case job_type
Step 9
Convert predicted indices back to original labels. Converting predicted indices back to original labels in AI and ML involves the reverse process of encoding categorical labels into numerical indices. When working with classification tasks, machine learning models often output predicted class indices instead of the original categorical labels.
It’s important to note that this reverse mapping process assumes a one-to-one mapping between the indices and the original labels. In cases where the original labels are not unique or there is a more complex relationship between the indices and the labels, additional handling may be required to ensure accurate conversion.
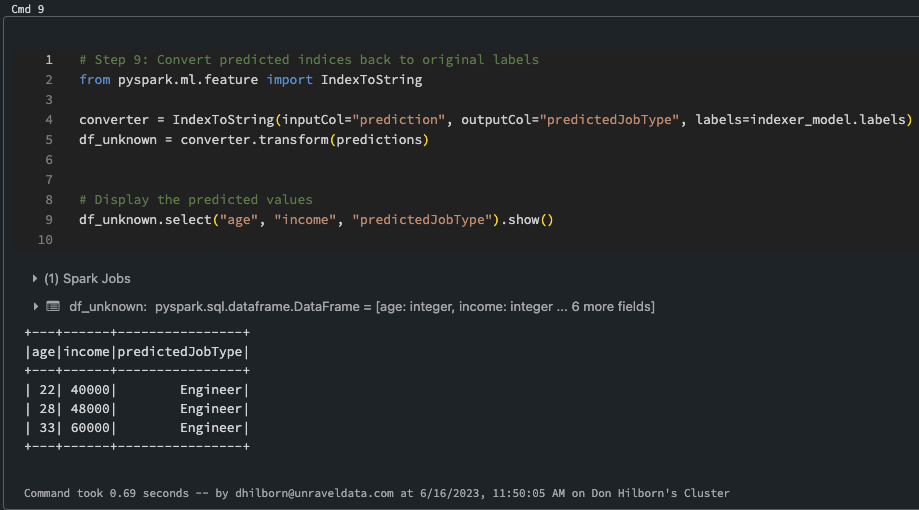
Step 9: Convert Predicted Indices Back to Original Labels
Recap
Machine learning (ML) and artificial intelligence (AI) have a significant impact on data engineering, enabling the processing, analysis, and extraction of insights from complex datasets. ML and AI empower data engineers with tools to improve data quality, automate processes, and facilitate data-driven decision-making. Logistic regression, decision trees, random forests, gradient boosting machines, and neural networks can predict categories based on past examples, aiding in correcting misclassified or improperly labeled data. Algorithms like linear regression, polynomial regression, support vector regression, or neural networks predict numeric values, addressing missing numeric entries. Clustering techniques like K-means, hierarchical clustering, or DBSCAN identify duplicates or near-duplicates. Models like Isolation Forest, Local Outlier Factor (LOF), or Auto-encoders detect outliers or anomalies, handling errors in the data. Machine learning techniques such as k-Nearest Neighbors (KNN) or Expectation-Maximization (EM) predict and fill in missing data. NLP models like BERT, GPT, or RoBERTa process text data for tasks like entity recognition and sentiment analysis. CNNs correct errors in image data, while RNNs or Transformer models handle sequence data.
Data engineers can use Databricks Notebook, for example, to address data quality issues by training a logistic regression model to predict missing categorical values. This involves loading and preparing the data, separating known and unknown instances, vectorizing features, converting categorical labels to indices, training the model, predicting missing values, and converting predicted indices back to original labels.
Ready to unlock the full potential of your data? Embrace the power of machine learning and artificial intelligence in data engineering. Improve data quality, automate processes, and make data-driven decisions with confidence. From logistic regression to neural networks, leverage powerful algorithms to predict categories, address missing values, detect anomalies, and more. Utilize clustering techniques to identify duplicates and near-duplicates. Process text, correct image errors, and handle sequential data effortlessly. Try out tools like Databricks Notebook to train models and resolve data quality issues. Empower your data engineering journey and transform your organization’s data into valuable insights. Take the leap into the world of ML and AI in data engineering today! You can start with this Notebook.