

What is Apache Kafka?
Apache Kafka is an open-source distributed event streaming platform used by thousands of companies for high-performance data pipelines, streaming analytics, data integration, and mission-critical applications.
Administrators, developers, and data engineers who use Kafka clusters struggle to understand what is happening in their Kafka implementations. There are out of the box solutions like Ambari and Cloudera manager which provide some high level monitoring however most customers find these tools to be insufficient for troubleshooting purposes. These tools also fail to provide right visibility down to the applications acting as consumers that are processing Kafka data streams.
For Unravel Data users Kafka monitoring and insights come out of the box with your installation. This blog is geared towards showing you best practices for using Unravel as a Kafka monitoring tool to detect and resolve issues faster. We assume you have a baseline knowledge of Kafka concepts and architecture.
Kafka monitoring tools
There are several tools and ways to monitor Kafka applications, such as open source tools, proprietary tools, and purpose-built tools. There are advantages associated with each option. Based on the availability of skilled resources and organizational priority, you can choose the best option.
Importance of using Kafka Monitoring tools
An enterprise-grade Kafka monitoring tool, like Unravel, enables your critical resources to avoid wasting hours manually configuring monitoring for Apache Kafka. They can get more time delivering value to end users. Locating an issue can be a challenging task without having a monitoring solution in place. Your data engineering team will have to test different use cases and educated guesses before they can get to the root of issues. Whereas proprietary Kafka monitoring tools like Unravel, provides AI-enabled insights, recommendation and automate remediation.
Monitoring Cluster Health
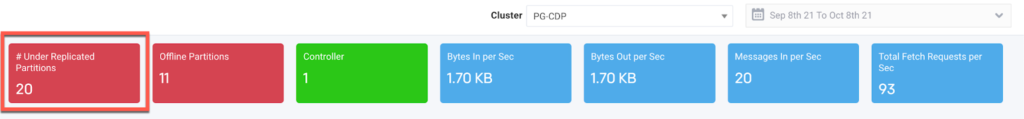
Unravel provides color coded KPIs per cluster to give you a quick overall view on the health of your Kafka cluster. The colors represent the following:
- Green = Healthy
- Red = Unhealthy and is something you will want to investigate
- Blue = Metrics on cluster activity
Let’s walk through a few scenarios and how we can use Unravel’s KPIs to help us through troubleshooting issues.
Under-replicated partitions
Under-replicated partitions tell us that replication is not going as fast as configured, which adds latency as consumers don’t get the data they need until messages are replicated. It also suggests that we are more vulnerable to losing data if we have a master failure. Any under replicated partitions at all constitute a bad thing and is something we’ll want to root cause to avoid any data loss. Generally speaking, under-replicated partitions usually point to an issue on a specific broker.
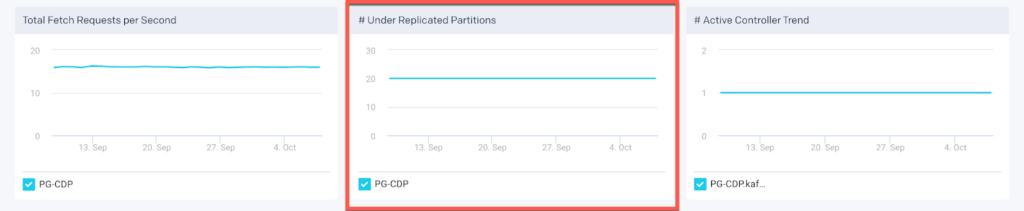
To investigate scenarios if under replicated partitions are showing up in your cluster we’ll need to understand how often this is occurring. For that we can use the following graphs to get a better understanding of this:
# of under replicated partitions
Another useful metric to monitor is “Log flush latency, 99th percentile“ graph which provides us the time it takes for the brokers to flush logs to disk:
Log Flush Latency, 99th Percentile
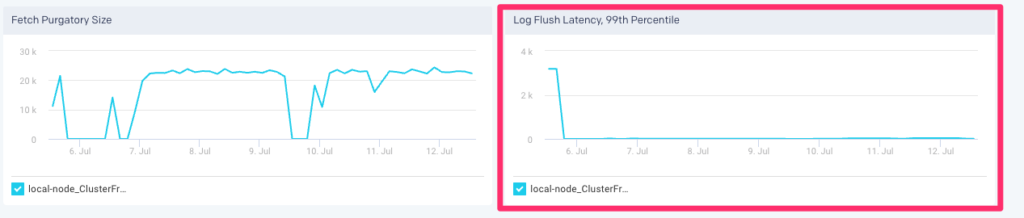
Log flush latency is important, because the longer it takes to flush log to disk, the more the pipeline backs up, the worse our latency and throughput. When this number goes up, even 10ms going to 20ms, end-to-end latency balloons which can also lead to under replicated partitions.
If we notice latency fluctuates greatly then we’ll want to identify which broker(s) are contributing to this. In order to do this we’ll go back to the “broker” tab and click on each broker to refresh the graph for the broker selected:
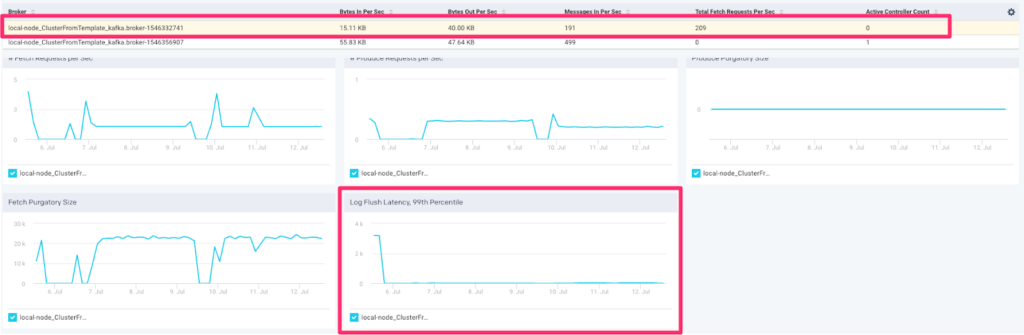
Once we identify the broker(s) with wildly fluctuating latency we will want to get further insight by investigating the logs for that broker. If the OS is having a hard time keeping up with log flush then we may want to consider adding more brokers to our Kafka architecture.
Offline partitions

Generally speaking you want to avoid offline partitions in your cluster. If you see this metric > 0 then there are broker level issues which need to be addressed.
Unravel provides the “# Offline Partitions” graph to understand when offline partitions occur:
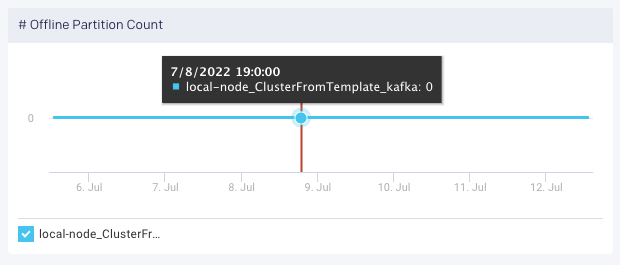
This metric provides the total number of topic partitions in the cluster that are offline. This can happen if the brokers with replicas are down, or if unclean leader election is disabled and the replicas are not in sync and thus none can be elected leader (may be desirable to ensure no messages are lost).
Controller Health

This KPI displays the number of brokers in the cluster reporting as the active controller in the last interval. Controller assignment can change over time as shown in the “# Active Controller Trend” graph:
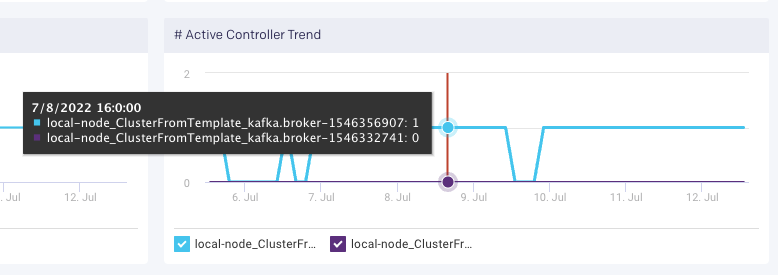
- “# Controller” = 0
- There is no active controller. You want to avoid this!
- “# Controller” = 1
- There is one active controller. This is the state that you want to see.
- “# Controller” > 1
- Can be good or bad. During steady state there should be only one active controller per cluster. If this is greater than 1 for only one minute, then it probably means the active controller switched from one broker to another. If this persists for more than one minute, troubleshoot the cluster for “split brain”.
For Active Controller <> 1 we’ll want to investigate logs on the broker level for further insight.
Cluster Activity

The last three KPI’s show cluster activity within the last 24 hours. They will always be colored blue because these metrics can neither be good or bad. These KPIs are useful in gauging activity in your Kafka cluster for the last 24 hours. You can also view these metrics via their respective graphs below:
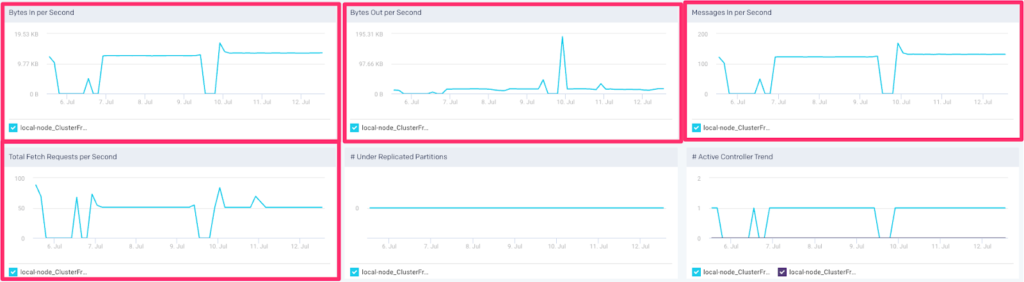
These metrics can be useful in understanding cluster capacity such as:
- Add additional brokers to keep up with data velocity
- Evaluate performance of topic architecture on your brokers
- Evaluate performance of partition architecture for a topic
The next section provides best practices in using Unravel to evaluate performance of your topics / brokers.
Topic Partition Strategy
A common challenge for Kafka admins is providing an architecture for the topics / partitions in the cluster which can support the data velocity coming from producers. Most times this is a shot in the dark because OOB solutions do not provide any actionable insight on activity for your topics / partitions. Let’s investigate how Unravel can help shed some light into this.
Producer architecture
On the producer side it can be a challenge in deciding on how to partition topics on the Kafka level. Producers can choose to send messages via key or use a round-robin strategy when no key has been defined for a message. Choosing the correct # of partitions for your data velocity are important in ensuring we have a real time architecture that is performant.
Let’s use Unravel to get a better understanding on how the current architecture is performing. We can then use this insight in guiding us in choosing the correct # of partitions.
To investigate – click on the topic tab and scroll to the bottom to see the list of topics in your Kafka cluster:
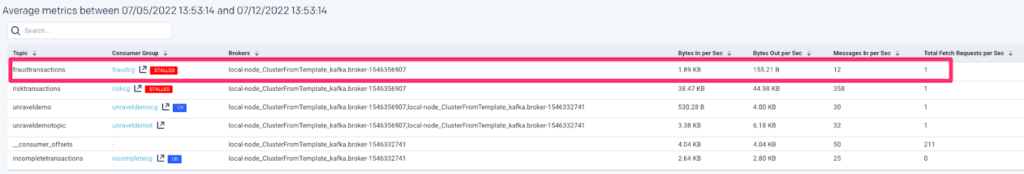
In this table we can quickly identify topics which have heavy traffic where we may want to understand how our partitions are performing. This is convenient in identifying topics which have heavy traffic.
Let’s click on a topic to get further insight:
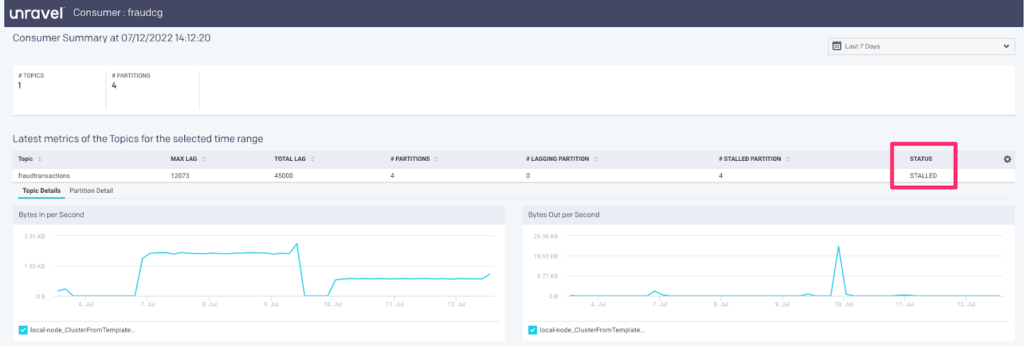
Consumer Group Architecture
We can also make changes on the consumer group side to scale according to your topic / partition architecture. Unravel provides a convenient view on the consumer group for each topic to quickly get a health status of the consumer groups in your Kafka cluster. If a consumer group is a Spark Streaming application then Unravel can also provide insights to that application thereby providing an end-to-end monitoring solution for your streaming applications.
See Kafka Insights for a use case on monitoring consumer groups, and lagging/stalled partitions or consumer groups.
Next steps:
Unravel is a purpose-built observability platform that helps you stop firefighting issues, control costs, and run faster data pipelines. What does that mean for you?
- Never worry about monitoring and observing your entire data estate.
- Reduce unnecessary cloud costs and the DataOps team’s application tuning burden.
- Avoid downtime, missed SLAs, and business risk with end-to-end observability and cost governance over your modern data stack.
How can you get started?
If you want to know more about Unravel Data, you can get a free health check report to unlock your data environment or contact us.
References:
https://www.signalfx.com/blog/how-we-monitor-and-run-kafka-at-scale/
https://www.confluent.io/blog/how-choose-number-topics-partitions-kafka-cluster
https://docs.confluent.io/current/control-center/systemhealth.html