

Table of Contents
Whether they know it or not, every company has become a data company. Data is no longer just a transactional byproduct, but a transformative enabler of business decision-making. In just a few years, modern data analytics has gone from being a science project to becoming the backbone of business operations to generate insights, fuel innovation, improve customer satisfaction, and drive revenue growth. But none of that can happen if data applications and pipelines aren’t running well.
Yet data-driven organizations find themselves caught in a crossfire: their data applications/pipelines are more important than ever, but managing them is more difficult than ever. As more data is generated, processed, and analyzed in an increasingly complex environment, businesses are finding the tools that served them well in the past or in other parts of their technology stack simply aren’t up to the task.
Modern data stacks are a different animal
Would you want an auto mechanic (no matter how excellent) to diagnose and fix a jet engine problem before you took flight? Of course not. You’d want an aviation mechanic working on it. Even though the basic mechanical principles and symptoms — engine trouble — are similar, automobiles and airplanes are very different under the hood. The same is true with observability for your data application stacks and your web application stacks. The process is similar, but they are totally different animals.
At first glance, it may seem that the leading APM monitoring and observability tools like Datadog, New Relic, Dynatrace, AppDynamics, etc., do the same thing as a modern data stack observability platform like Unravel. And in the sense that both capture and correlate telemetry data to help you understand issues, that’s true. But one is designed for web apps, while the other for modern data pipelines and applications.
Observability for the modern data stack is indeed completely different from observability for web (or mobile) applications. They are built and behave differently, face different types of issues for different reasons, requiring different analyses to resolve problems. To fully understand, troubleshoot, and optimize (for both performance and cost) data applications and pipelines, you need an observability platform that’s built from the ground up to tackle the specific complexities of the modern data stack. Here’s why.
What’s different about modern data applications?
First and foremost, the whole computing framework is different for data applications. Data workloads get broken down into multiple, smaller, often similar parts each processed concurrently on a separate node, with the results re-combined upon completion — parallel processing. And this happens at each successive stage of the workflow as a whole. Dependencies within data applications/pipelines are deep and layered. It’s crucial that everything — execution time, scheduling and orchestration, data lineage, and layout — be in sync.
In contrast, web applications are a tangle of discrete request-response services processed individually. Each service does its own thing and operates relatively independently. What’s most important is the response time of each service request and how that contributes to the overall response time of a user transaction. Dependencies within web apps are not especially deep but are extremely broad.
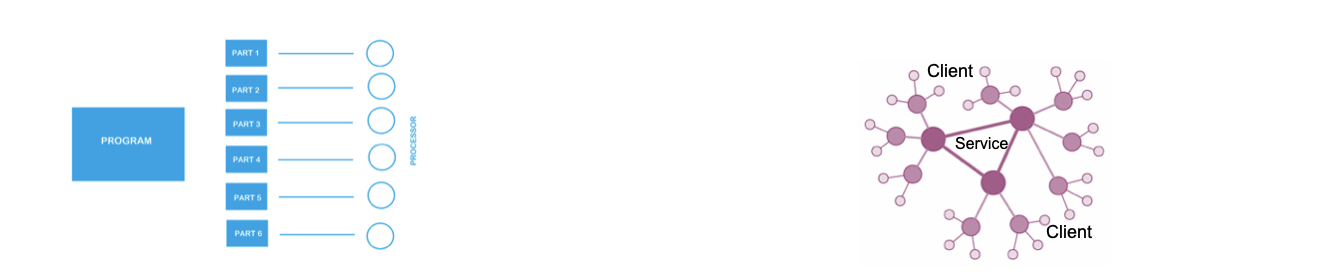
Web apps are request-response; data apps process in parallel.
Consequently, there’s a totally different class of problems, root causes, and remediation for data apps vs. web apps. When doing your detective work into a slow or failed app, you’re looking at a different kind of culprit for a different type of crime, and need different clues (observability data). You need a whole new set of data points, different KPIs, from distinct technologies, visualized in another way, and correlated in a uniquely modern data stack–specific context.
The flaw with using traditional APM tools for modern data stacks
What organizations who try to use traditional APM for the modern data stack find is that they wind up getting only a tiny fraction of the information they need from a solution like Dynatrace or Datadog or AppDynamics, such as infrastructure and services-level metrics. But over 90% of the information data teams need is buried in places where web APM simply doesn’t go — you need an observability platform specifically designed to dig through all the systems to get this data and then stitch it together into a unified context.
This is where the complexity of modern data applications and pipelines rears its head. The modern data stack is not a single system, but a collection of systems. You might have Kafka or Kinesis or Data Factory for data ingestion, some sort of data lake to store it, then possibly dozens of different components for different types of processing: Druid for real-time processing, Databricks for AI/ML processing, BigQuery or Snowflake for data warehouse processing, another technology for batch processing — the list goes on. So you need to capture deep information horizontally across all the various systems that make up your data stack. But you also need to capture deep information vertically, from the application down to infrastructure and everything in between (pipeline definitions, data usage/lineage, data types and layout, job-level details, execution settings, container-level information, resource allocation, etc.).
Cobbling it together manually via “swivel chair whiplash,” jumping from screen to screen, is a time-consuming, labor-intensive effort that can take hours — even days — for a single problem. And still there’s a high risk that it won’t be completely accurate. There is simply too much data to make sense of, in too many places. Trying to correlate everything on your own, whether by hand or with a homegrown jury-rigged solution, requires two things that are always in short supply: time and expertise. Even if you know what you’re looking for, trolling through hundreds of log files is like looking for a needle in a stack of needles.
An observability platform purpose-built for the modern data stack can do all that for you automatically. Trying to make traditional APM observe data stacks is simply using the wrong tool for the job at hand.
DevOps APM vs. DataOps observability in practice
With the growing complexity in today’s modern data systems, any enterprise-grade observability solution should do 13 things:
- Capture full-stack data — both horizontally and vertically — from the various systems that make up the stack, including engines, schedulers, services, and cloud provider
- Capture information about all data applications: pipelines, warehousing, ETL/ELT, machine learning models, etc.
- Capture information about datasets, lineage, users, business units, computing resources, infrastructure, and more
- Correlate, not just aggregate, data collected into meaningful context
- Understand all application/pipeline dependencies on data, resources, and other apps
- Visualize data pipelines end to end from source to output
- Provide a centralized view of your entire data stack, for governance, usage analytics, etc.
- Identify baseline patterns and detect anomalies
- Automatically analyze and pinpoint root causes
- Proactively alert to prevent problems
- Provide recommendations and remedies to solve issues
- Automate resolution or self-healing
- Show the business impact
While the principles are the same for data app and web app observability, how to go about this and what it looks like are markedly dissimilar.
Everything starts with the data — and correlating it
If you don’t capture the right kind of telemetry data, nothing else matters.
APM solutions inject agents that run 24×7 to monitor the runtime and behavior of applications written in .NET, Java, Node.js, PHP, Ruby, Go, and dozens of other languages. These agents collect data on all the individual services as they snake through the application ecosystem. Then APM stitches together all the data to understand which services the application calls and how the performance of each discrete service call impacts performance of the overall transaction. The various KPIs revolve around response times, availability (up/down, green/red), and the app users’ digital experience. The volume of data to be captured is incredibly broad, but not especially deep.
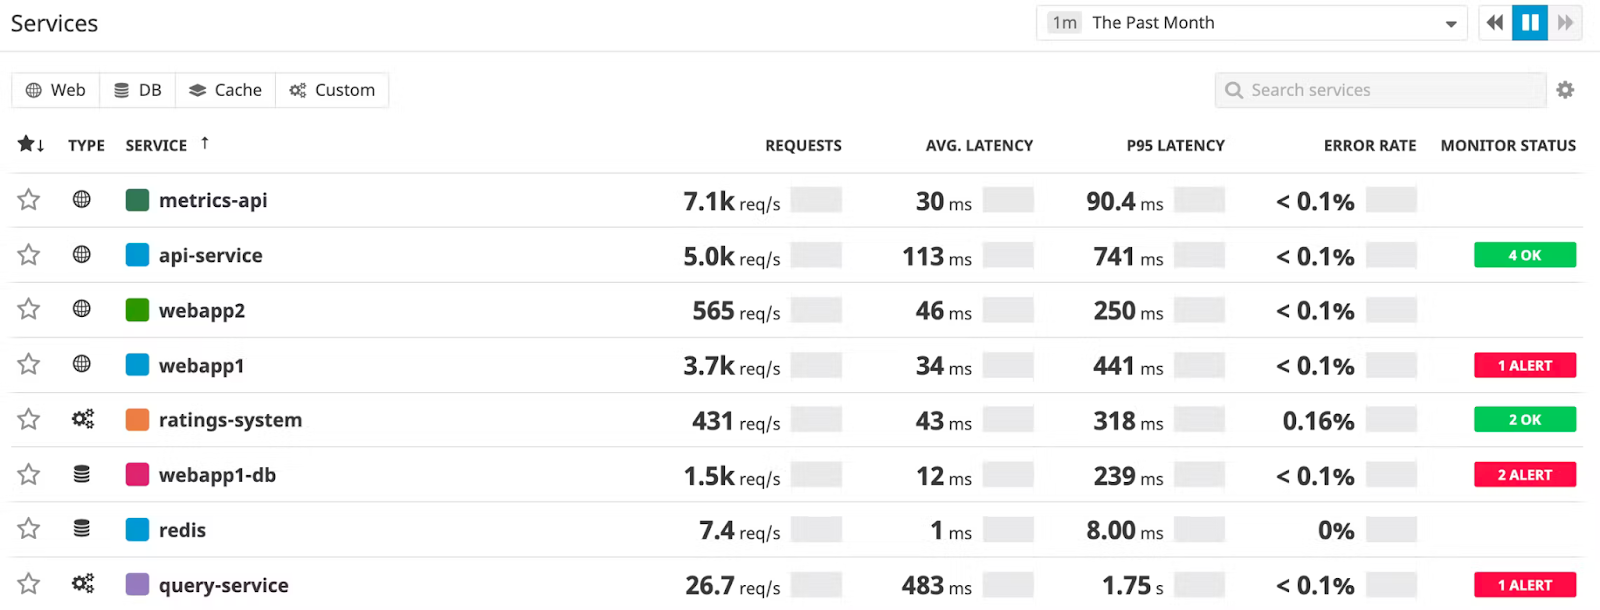
APM is primarily concerned with response times and availability. Here, Datadog shows red/green status and aggregated metrics.
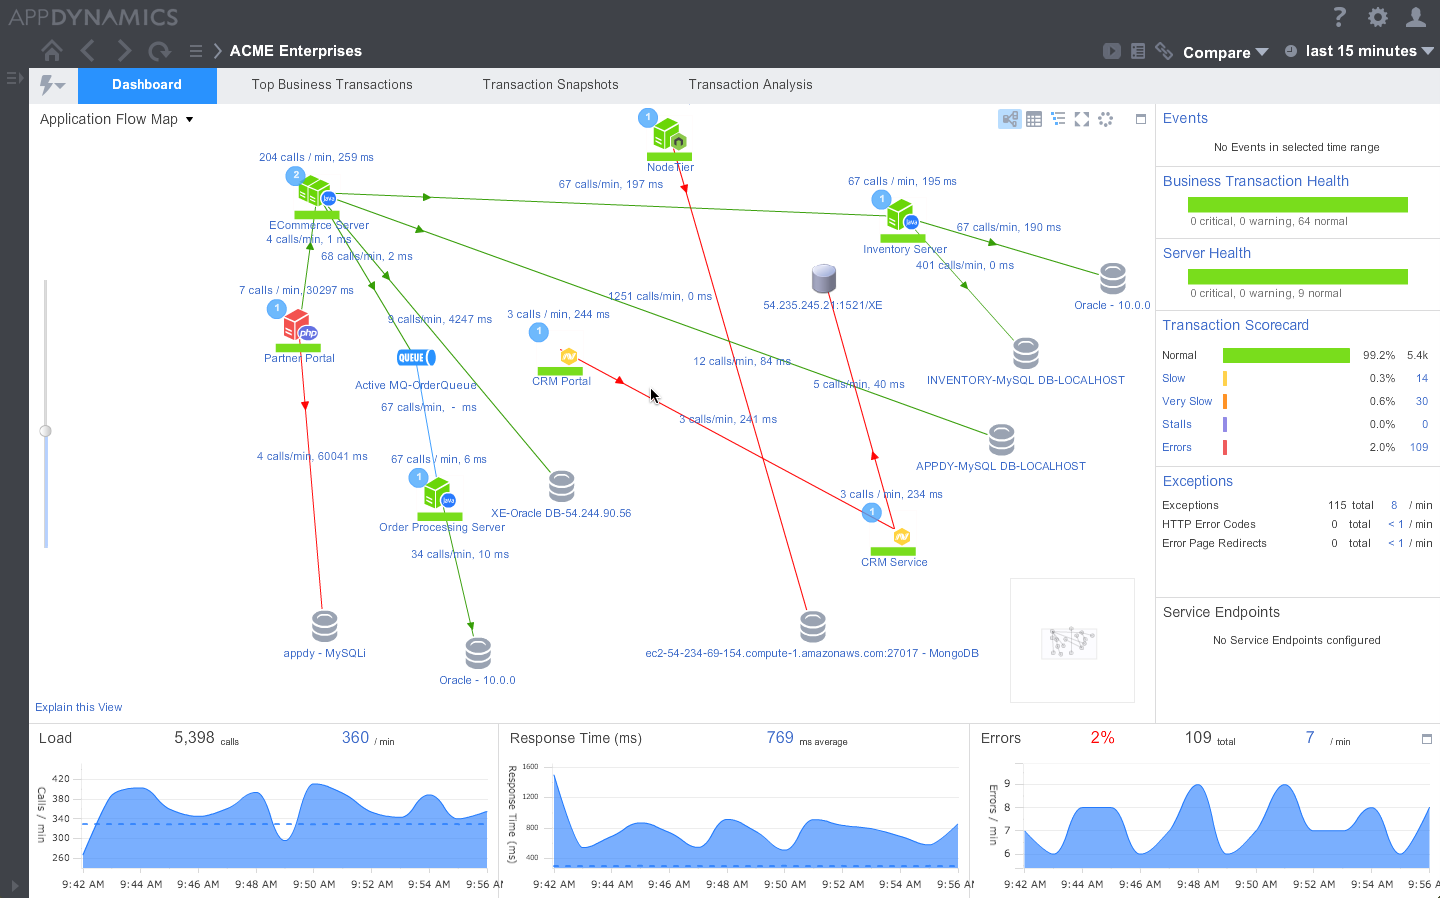
Here, AppDynamics shows the individual response times for various interconnected services.
The telemetry details to be captured and correlated for data applications/pipelines, on the other hand, need to be both broad and extremely deep. A modern data workload comprises hundreds of jobs, each broken down into parallel-processing parts, with each part executing various tasks. And each job feeds into hundreds of other jobs and applications not only in this particular pipeline but all the other pipelines in the system.
Today’s pipelines are built on an assortment of distributed processing engines; each might be able to monitor its own application’s jobs but not show you how everything works as a whole. You need to see details at a highly granular level — for each sub-task within each sub-part of each job — and then marry them together into a single pane of glass that comprises the bigger picture at the application, pipeline, platform, and cluster levels.
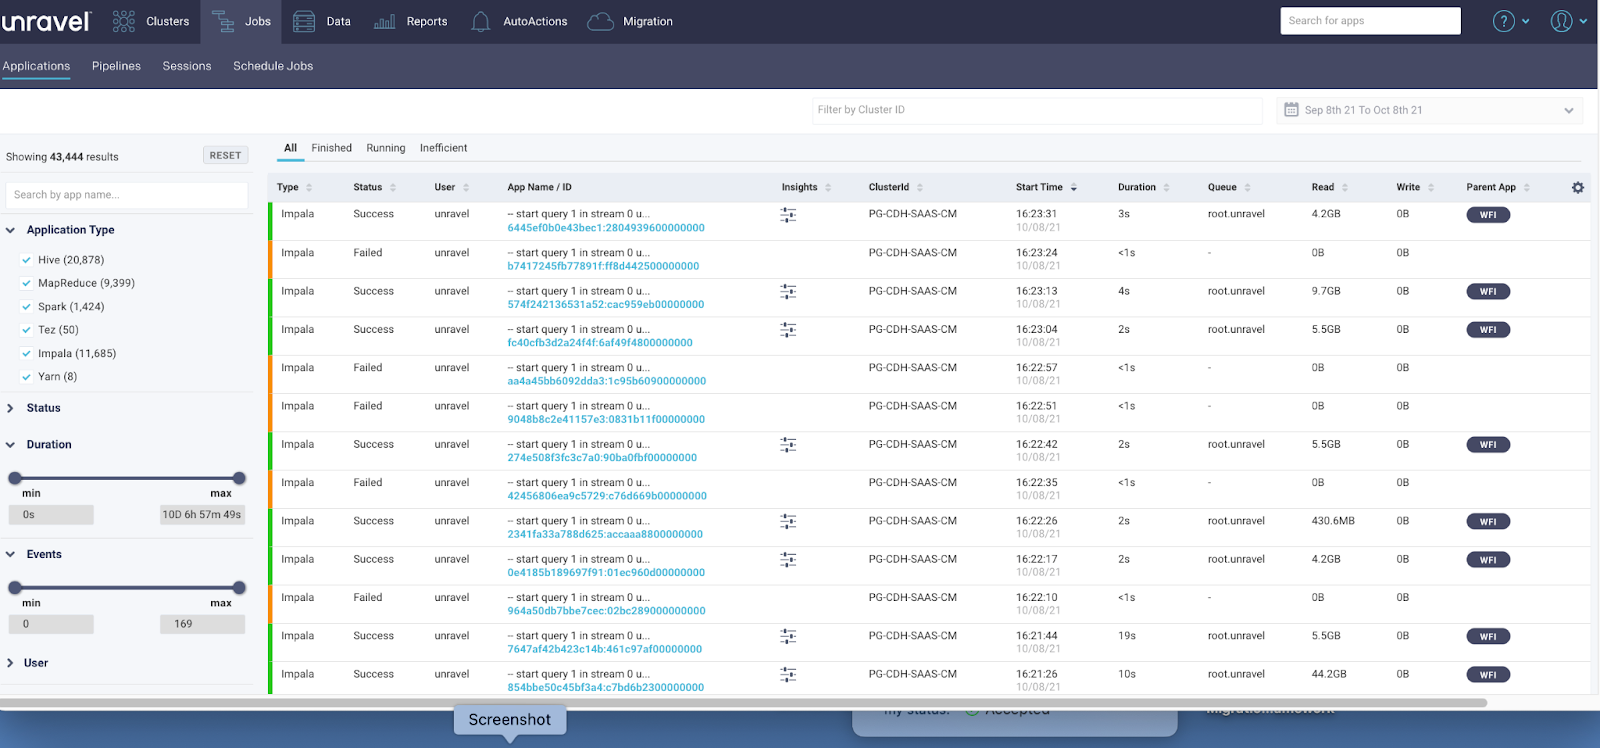
DataOps observability (here, Unravel) looks at completely different metrics at the app level . .
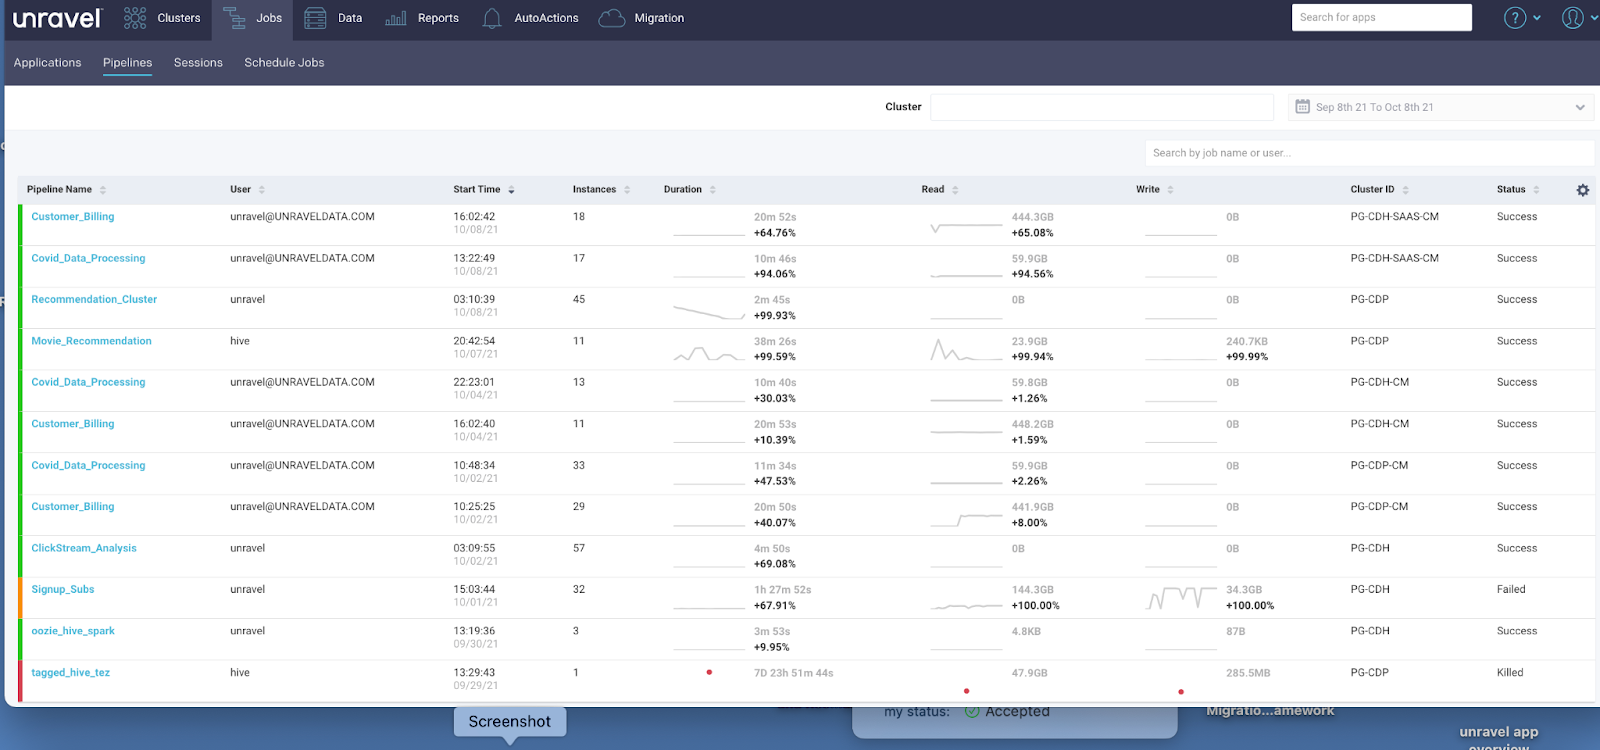
. . . as well as the pipeline level.
Let’s take troubleshooting a slow Spark application as an example. The information you need to investigate the problem lives in a bunch of different places, and the various tools for getting this data give you only some of what you need, not all.
The Spark UI can tell you about the status of individual jobs but lacks infrastructure and configuration details and other information to connect together a full pipeline view. Spark logs help you retrospectively find out what happened to a given job (and even what was going on with other jobs at the same time) but don’t have complete information about resource usage, data partitioning, container configuration settings, and a host of other factors that can affect performance. And, of course, Spark tools are limited to Spark. But Spark jobs might have data coming in from, say, Kafka and run alongside a dozen other technologies.
Conversely, platform-specific interfaces (Databricks, Amazon EMR, Dataproc, BigQuery, Snowflake) have the information about resource usage and the status of various services at the cluster level, but not the granular details at the application or job level.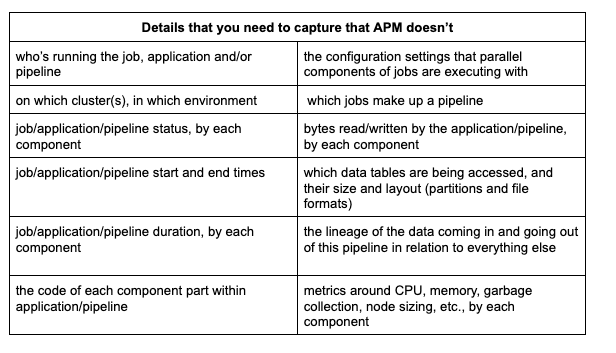 Having all the information specific for data apps is a great start, but it isn’t especially helpful if it’s not all put into context. The data needs to be correlated, visualized, and analyzed in a purposeful way that lets you get to the information you need easily and immediately.
Then there’s how data is visualized and analyzed
Even the way you need to look at a data application environment is different. A topology map for a web application shows dependencies like a complex spoke-and-wheel diagram. When visualizing web app environments, you need to see the service-to-service interrelationships in a map like this:

How Dynatrace visualizes service dependencies in a topology map.
With drill-down details on service flows and response metrics:
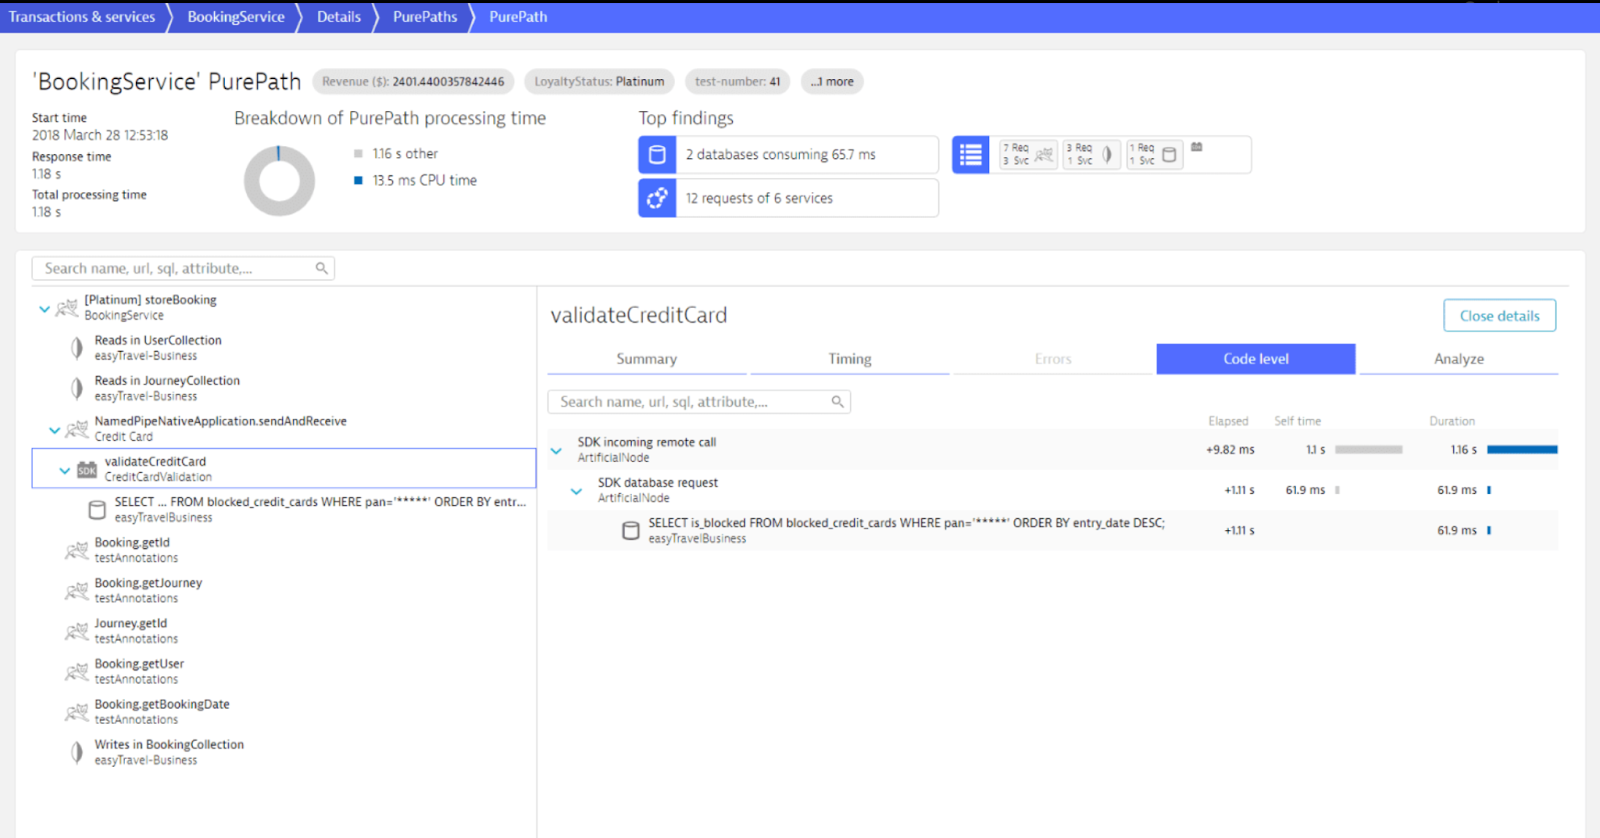
Dynatrace drill-down details
For a modern data environment, you need to see how all the pipelines are interdependent and in what order. The view is more like a complex system of integrated funnels:
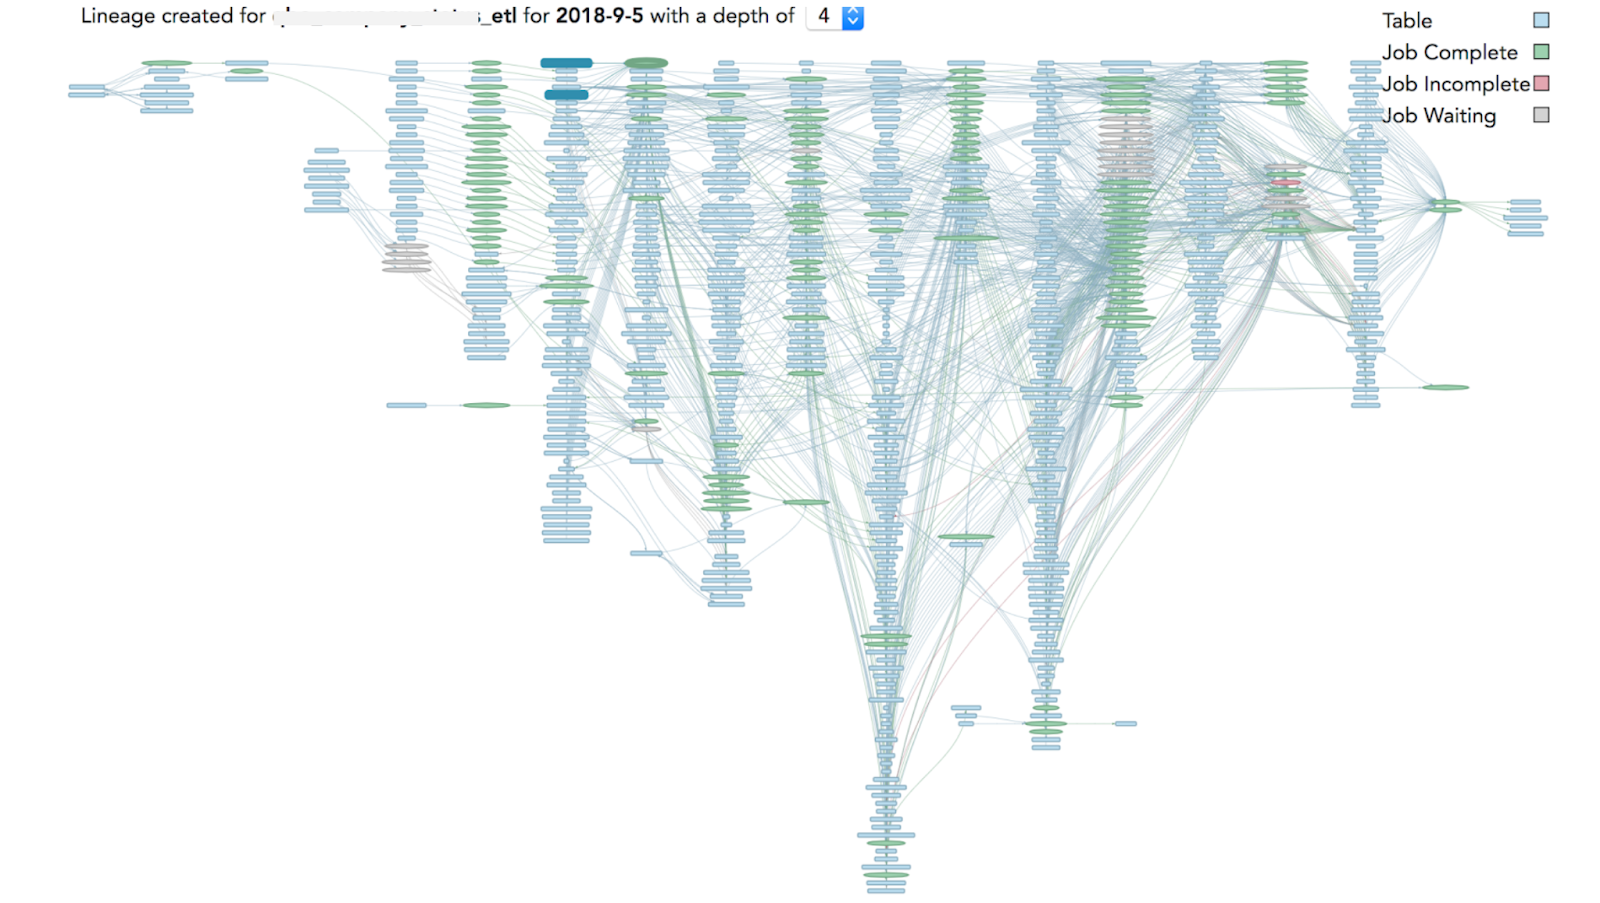
A modern data estate involves many interrelated application and pipeline dependencies (Source: Sandeep Uttamchandani)
You need full observability into not only how all the pipelines relate to one another, but all the dependencies of multiple applications within each pipeline . . .
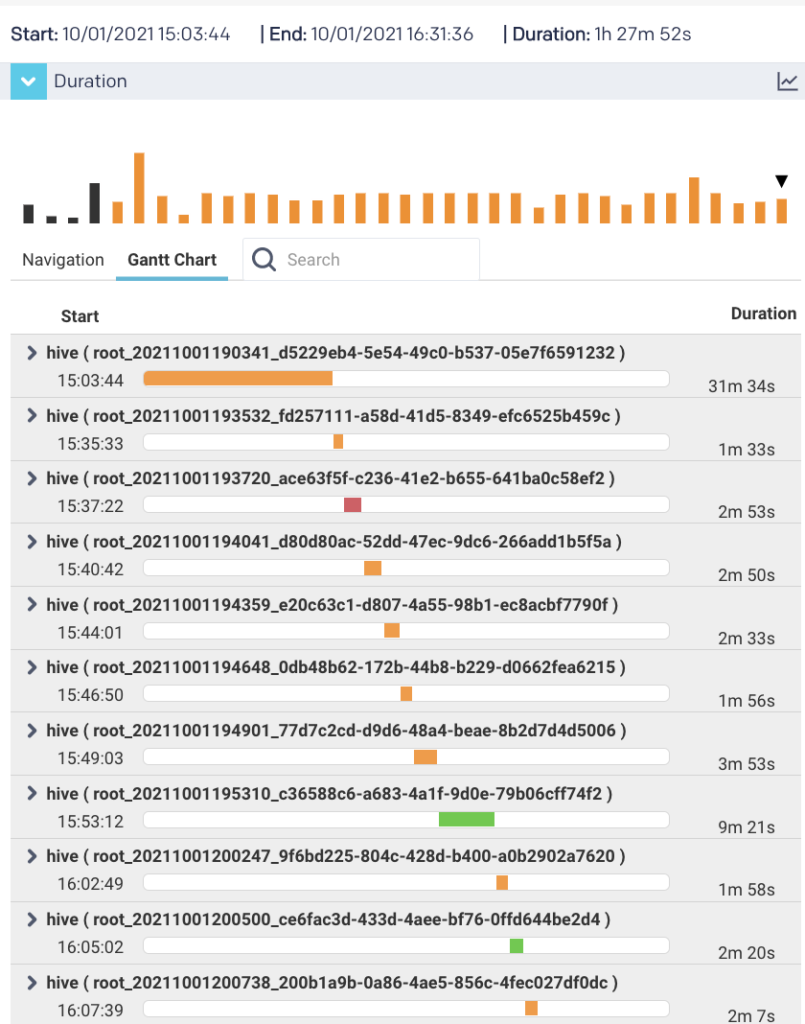
An observability platform purpose-built for modern data stacks provides visibility into all the individual applications within a particular pipeline
. . . with granular drill-down details into the various jobs within each application. . .
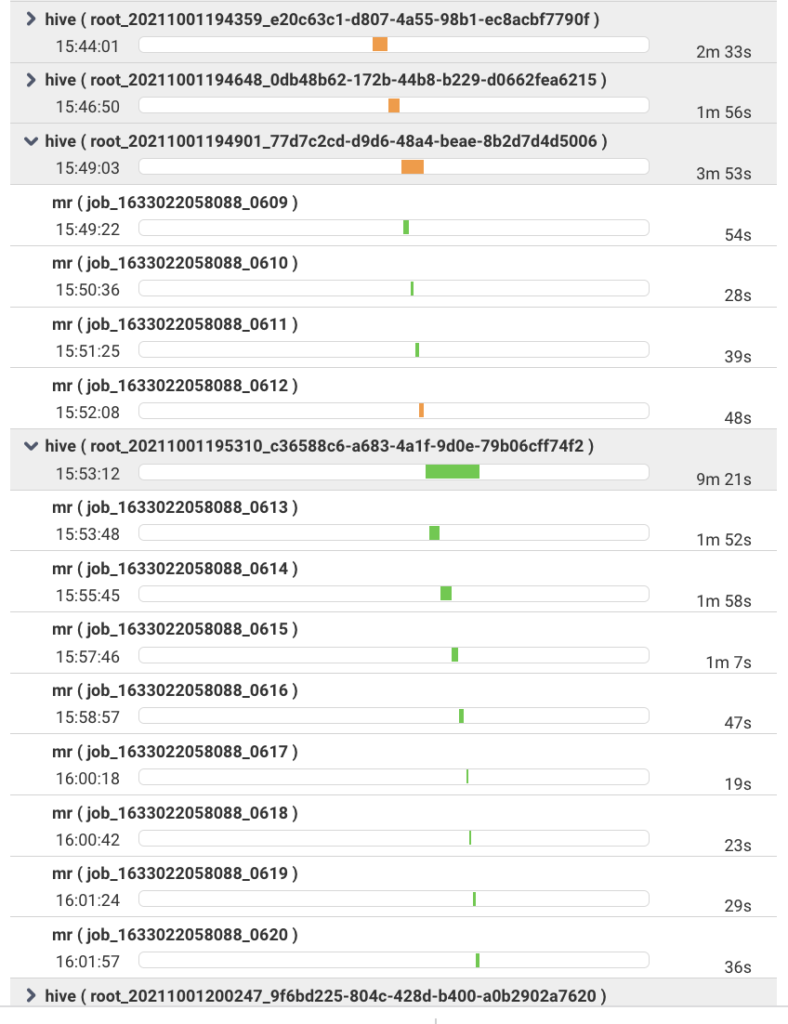
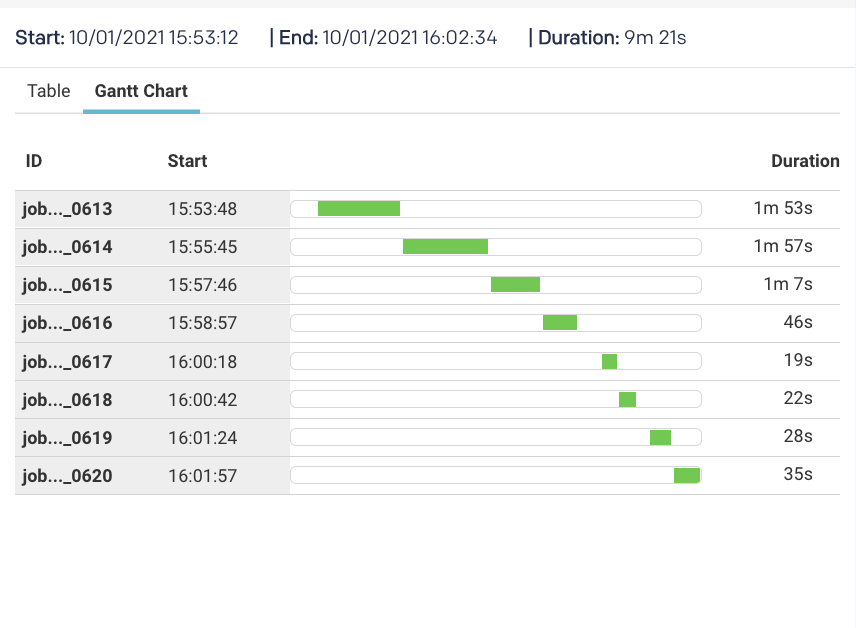
. . and the sub-parts of each job processing in parallel . . .
How things get fixed
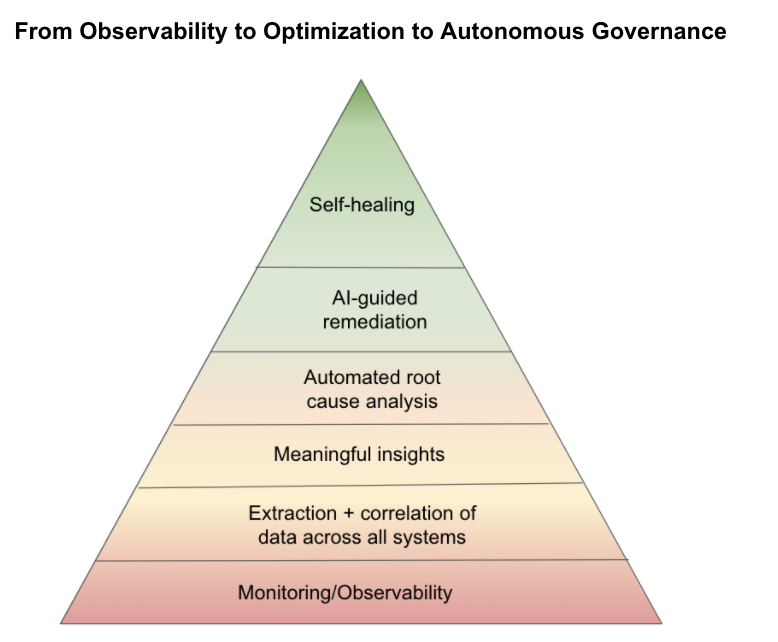
Monitoring and observability tell you what’s going on. But to understand why, you need to go beyond observability and apply AI/ML to correlate patterns, identify anomalies, derive meaningful insights, and perform automated root cause analysis. “Beyond observability” is a continuous and incremental spectrum, from understanding why something happened to knowing what to do about it to automatically fixing the issue. But to make that leap from good to great, you need ML models and AI algorithms purpose-built for the task at hand. And that means you need complete data about everything in the environment.
 The best APM tools have some sort of AI/ML-based engine (some are more sophisticated than others) to analyze millions of data points and dependencies, spot anomalies, and alert on them.
For data applications/pipelines, the type of problems and their root causes are completely different than web apps. The data points and dependencies needing to be analyzed are completely different. The patterns, anomalous behavior, and root causes are different. Consequently, the ML models and AI algorithms need to be different.
In fact, DataOps observability needs to go even further than APM. The size of modern data pipelines and the complexities of multi-layered dependencies — from clusters to platforms and frameworks to applications to jobs within applications to sub-parts of those jobs to the various tasks within each sub-part — could lead to a lot of trial-and-error resolution effort even if you know what’s happening and why. What you really need to know is what to do.
An AI-driven recommendation engine like Unravel goes beyond the standard idea of observability to tell you how to fix a problem. For example, if there’s one container in one part of one job that’s improperly sized and so causing the entire pipeline to fail, Unravel not only pinpoints the guilty party but tells you what the proper configuration settings would be. Or another example is that Unravel can tell you exactly why a pipeline is slow and how you can speed it up. This is because Unravel’s AI has been trained over many years to understand the specific intricacies and dependencies of modern data stacks.
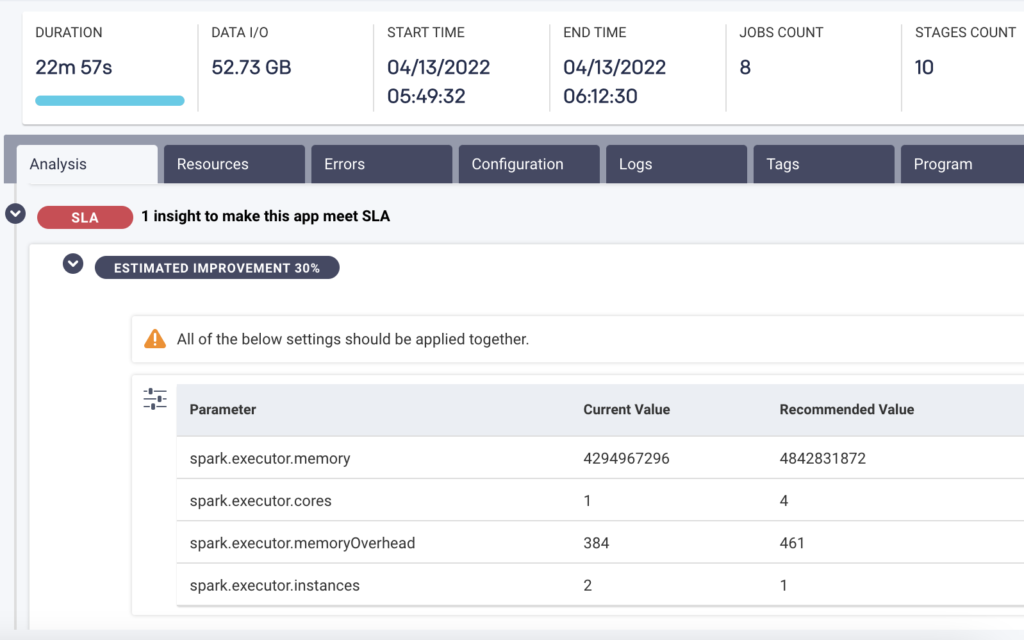
AI recommendations tell you exactly what to do to optimize for performance.
Business impact
Sluggish or broken web applications cost organizations money in terms of lost revenue and customer dissatisfaction. Good APM tools are able to put the problem into a business context by providing a lot of details about how many customer transactions were affected by an app problem.
As more and more of an organization’s operations and decision-making revolve around data analytics, data pipelines that miss SLAs or fail outright have an increasingly significant (negative) impact on the company’s revenue, productivity, and agility. Businesses must be able to depend on their data applications, so their applications need to have predictable, reliable behavior.
For example: If a fraud prevention data pipeline stops working for a bank, it can cause billions of dollars in fraudulent transactions going undetected. Or a slow healthcare analysis pipeline may increase risk for patients by failing to provide timely responses. Measuring and optimizing performance of data applications and pipelines correlates directly to how well the business is performing.
Businesses need proactive alerts when pipelines deviate from their normal behavior. But going “beyond observability” would tell them automatically why this is happening and what they can do to get the application back on track. This allows businesses to have reliable and predictable performance.
There’s also an immediate bottom-line impact that businesses need to consider: maximizing their return on investment and controlling/optimizing cloud spend. Modern data applications process a lot of data, which usually consumes a large amount of resources — and the meter is always running. This means the cloud bills can rack up fast.
To keep costs from spiraling out of control, businesses need actionable intelligence on how best to optimize their data pipelines. An AI recommendations engine can take all the profile and other key information it has about applications and pipelines and identify where jobs are overprovisioned or could be tuned for improvement. For example: optimizing code to remove inefficiencies, right-sizing containers to avoid wastage, providing the best data partitioning based on goals, and much more.
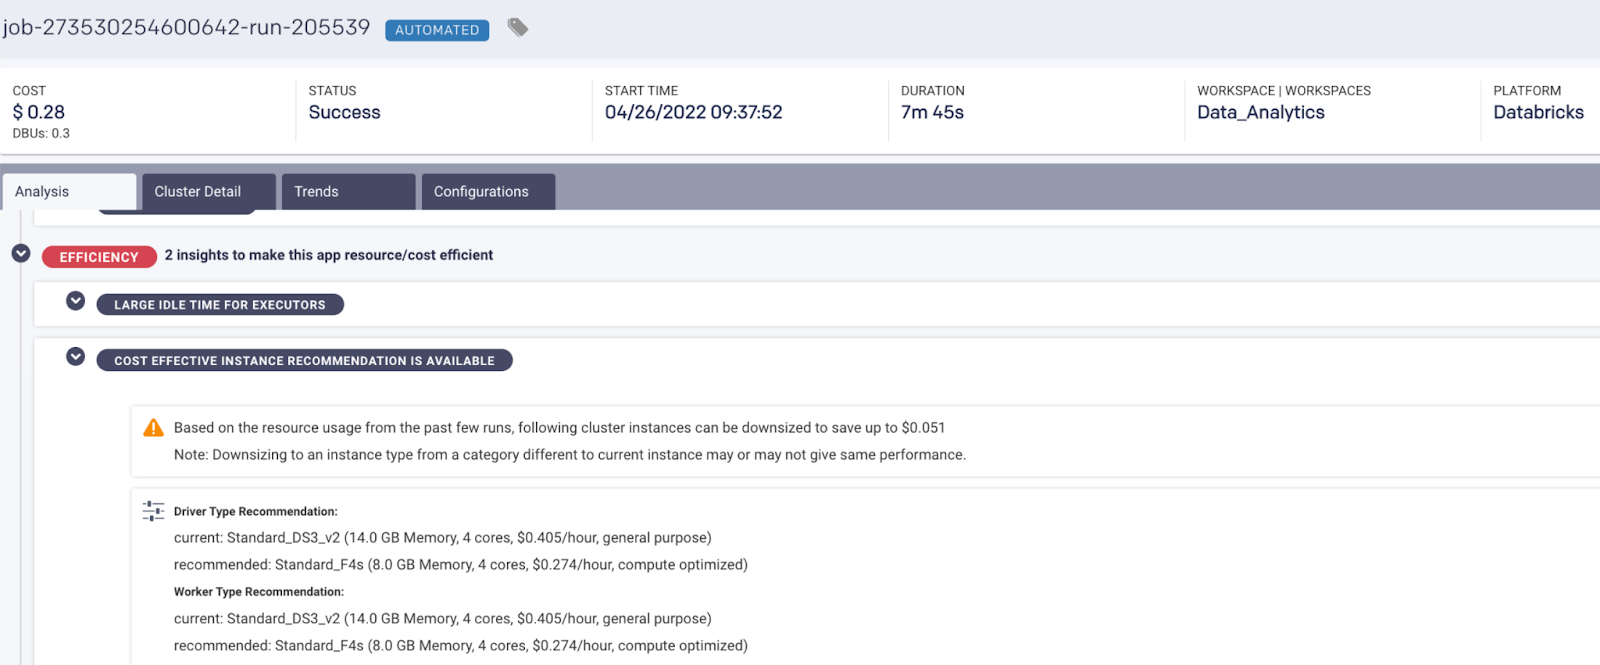
AI recommendations pinpoint exactly where and how to optimize for cost.
AI recommendations and deep insights lay the groundwork for putting in place some automated cost guardrails for governance. Governance is really all about converting the AI recommendations and insights into impact. Automated guardrails (per user, app, business unit, project) would alert operations teams about unapproved spend, potential budget overruns, jobs that run over a certain time/cost threshold, and the like. You can then proactively manage your budget, rather than getting hit with sticker shock after the fact.
In a nutshell
Application monitoring and observability solutions like Datadog, Dynatrace, and AppDynamics are excellent tools for web applications. Their telemetry, correlation, anomaly detection, and root cause analysis capabilities do a good job of helping you understand, troubleshoot, and optimize most areas of your digital ecosystem — one exception being the modern data stack. They are by design built for general-purpose observability of user interactions.
In contrast, an observability platform for the modern data stack like Unravel is more specialized. Its telemetry, correlation, anomaly detection, root cause analysis capabilities — and in the case of Unravel uniquely, its AI-powered remediation recommendations, automated guardrails, and automated remediation — is by design built specifically to understand, troubleshoot, and optimize modern data workloads.
Observability is all about context. Traditional APM provides observability in context for web applications, but not for data applications and pipelines. That’s not a knock on these APM solutions. Far from it. They do an excellent job at what they were designed for. They just weren’t built for observability of the modern data stack. That requires another kind of solution designed specifically for a different kind of animal.