

Table of Contents
The term “observability” means many things to many people. A lot of energy has been spent—particularly among vendors offering an observability solution—in trying to define what the term means in one context or another.
But instead of getting bogged down in the “what” of observability, I think it’s more valuable to address the “why.” What are we trying to accomplish with observability? What is the end goal?
At Unravel, I’m not only the co-founder and CTO but also the head of our Customer Success team, so when thinking about modern data stack observability, I look at the issue through the lens of customer problems and what will alleviate their pain and solve their challenges.
I start by considering the ultimate end goal or Holy Grail: autonomous systems. Data teams just want things to work; they want everything to be taken care of, automatically. They want the system itself to be watching over issues, resolving problems without any human intervention at all. It’s the true spirit of AI: all they have to do is tell the system what they want to achieve. It’s going from reactive to proactive. No one ever has to troubleshoot the problem, because it was “fixed” before it ever saw the light of day. The system recognizes that there will be a problem and auto-corrects the issue invisibly.
As an industry, we’re not completely at that point yet for the modern data stack. But we’re getting closer.
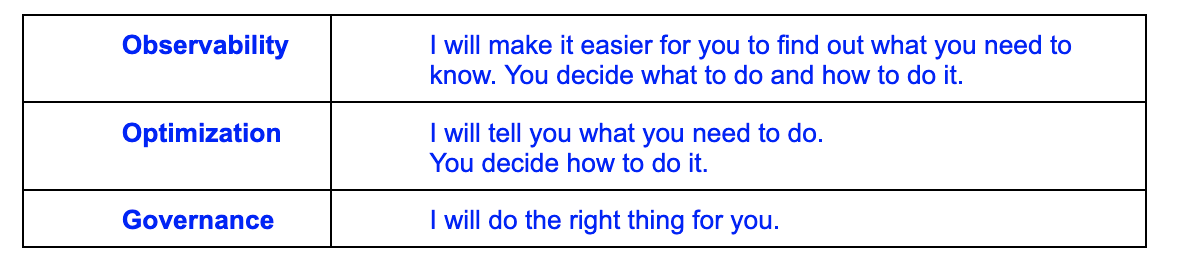
We are on a continuous and incremental spectrum of progressively less toil and more automation: going from the old ways of manually stitching together logs, metrics, traces, and events from disparate systems; to accurate extraction and correlation of all that data in context; to automatic insights and identification of significant patterns; to AI-driven actionable recommendations; to autonomous governance.
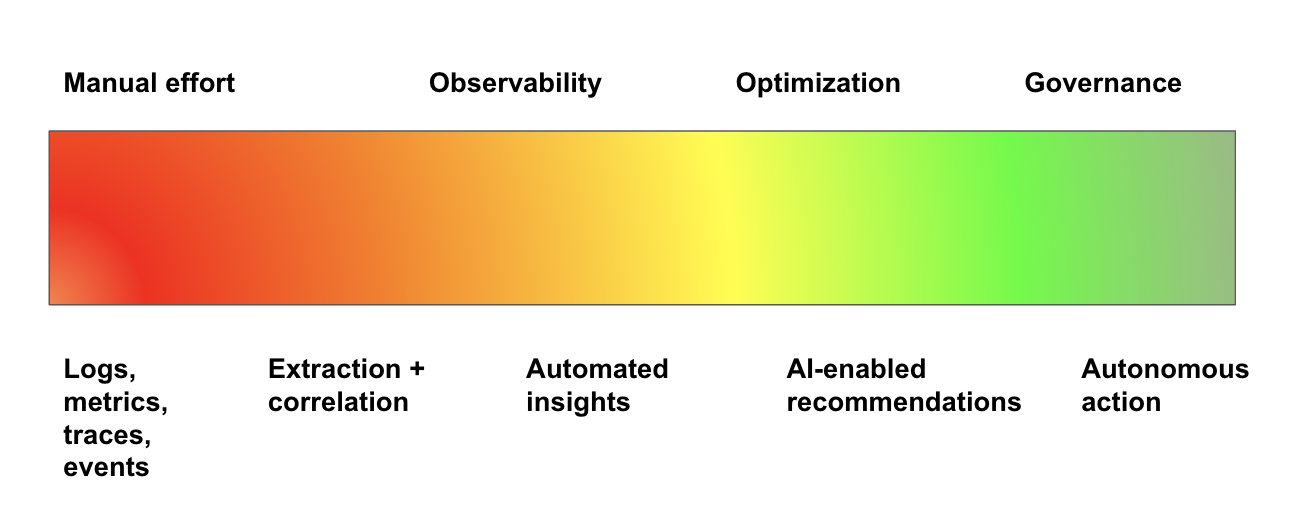
“Beyond observability” is on a spectrum from manual to autonomous
Create a free account
Beyond observability: to optimization and on to governance
Let’s say you have a data pipeline from Marketing Analytics called ML_Model_Update_and_Scoring that’s missing its SLA. The SLA specifies that the pipeline must run in less than 20 minutes, but it’s taking 25 minutes. What happened? Why is the data pipeline now too slow? And how can you tune things to meet the SLA? This particular application is pretty complex, with multiple jobs processing in parallel and several components (orchestration, compute, auto-scaling clusters, streaming platforms, dashboarding), so the problem could be anywhere along the line.
It’s virtually impossible to manually pore through the thousands of logs that are generated at each stage of the pipeline from the various tools—Spark and Kafka and Airflow logs, Databricks cluster logs, etc.—to “untangle the wires” and figure out where the slowdown could be. But where should you even start? Even if you have an idea of what you’re looking for, it can take hours—even days or weeks for highly complex workflows—to stitch together all the raw metrics/events/logs/traces data to figure out what’s meaningful to why your data pipeline is missing its SLA. Just a single app can run 10,000 containers on 10,000 nodes, with 10,000 logs.
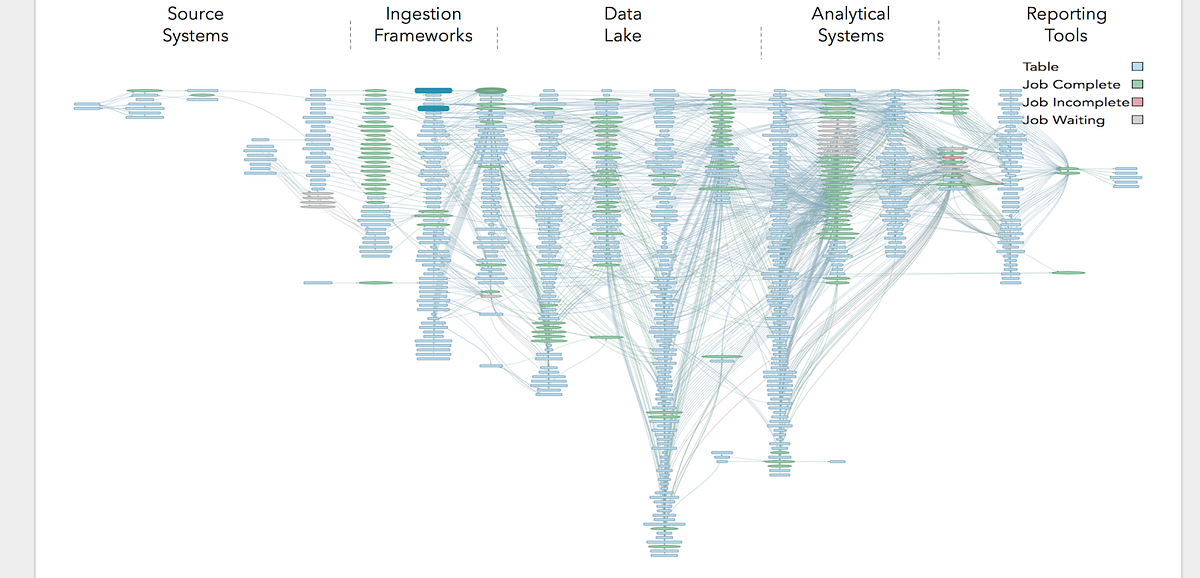
Modern data stacks are simply too complex for humans to manage by hand
That’s where observability comes in.
Observability tells you “what”
Instead of having to sift through reams of logs and cobble together everything manually, full-stack observability extracts all the relevant raw data from all the various components of your data stack and correlates it to paint a picture of what’s going on. All the information captured by telemetry data (logs, metrics, events, traces) is pulled together in context and in the “language you’re speaking”—the language of data applications and pipelines.
Full-stack observability correlates data from all systems to provide a clear picture of what happened
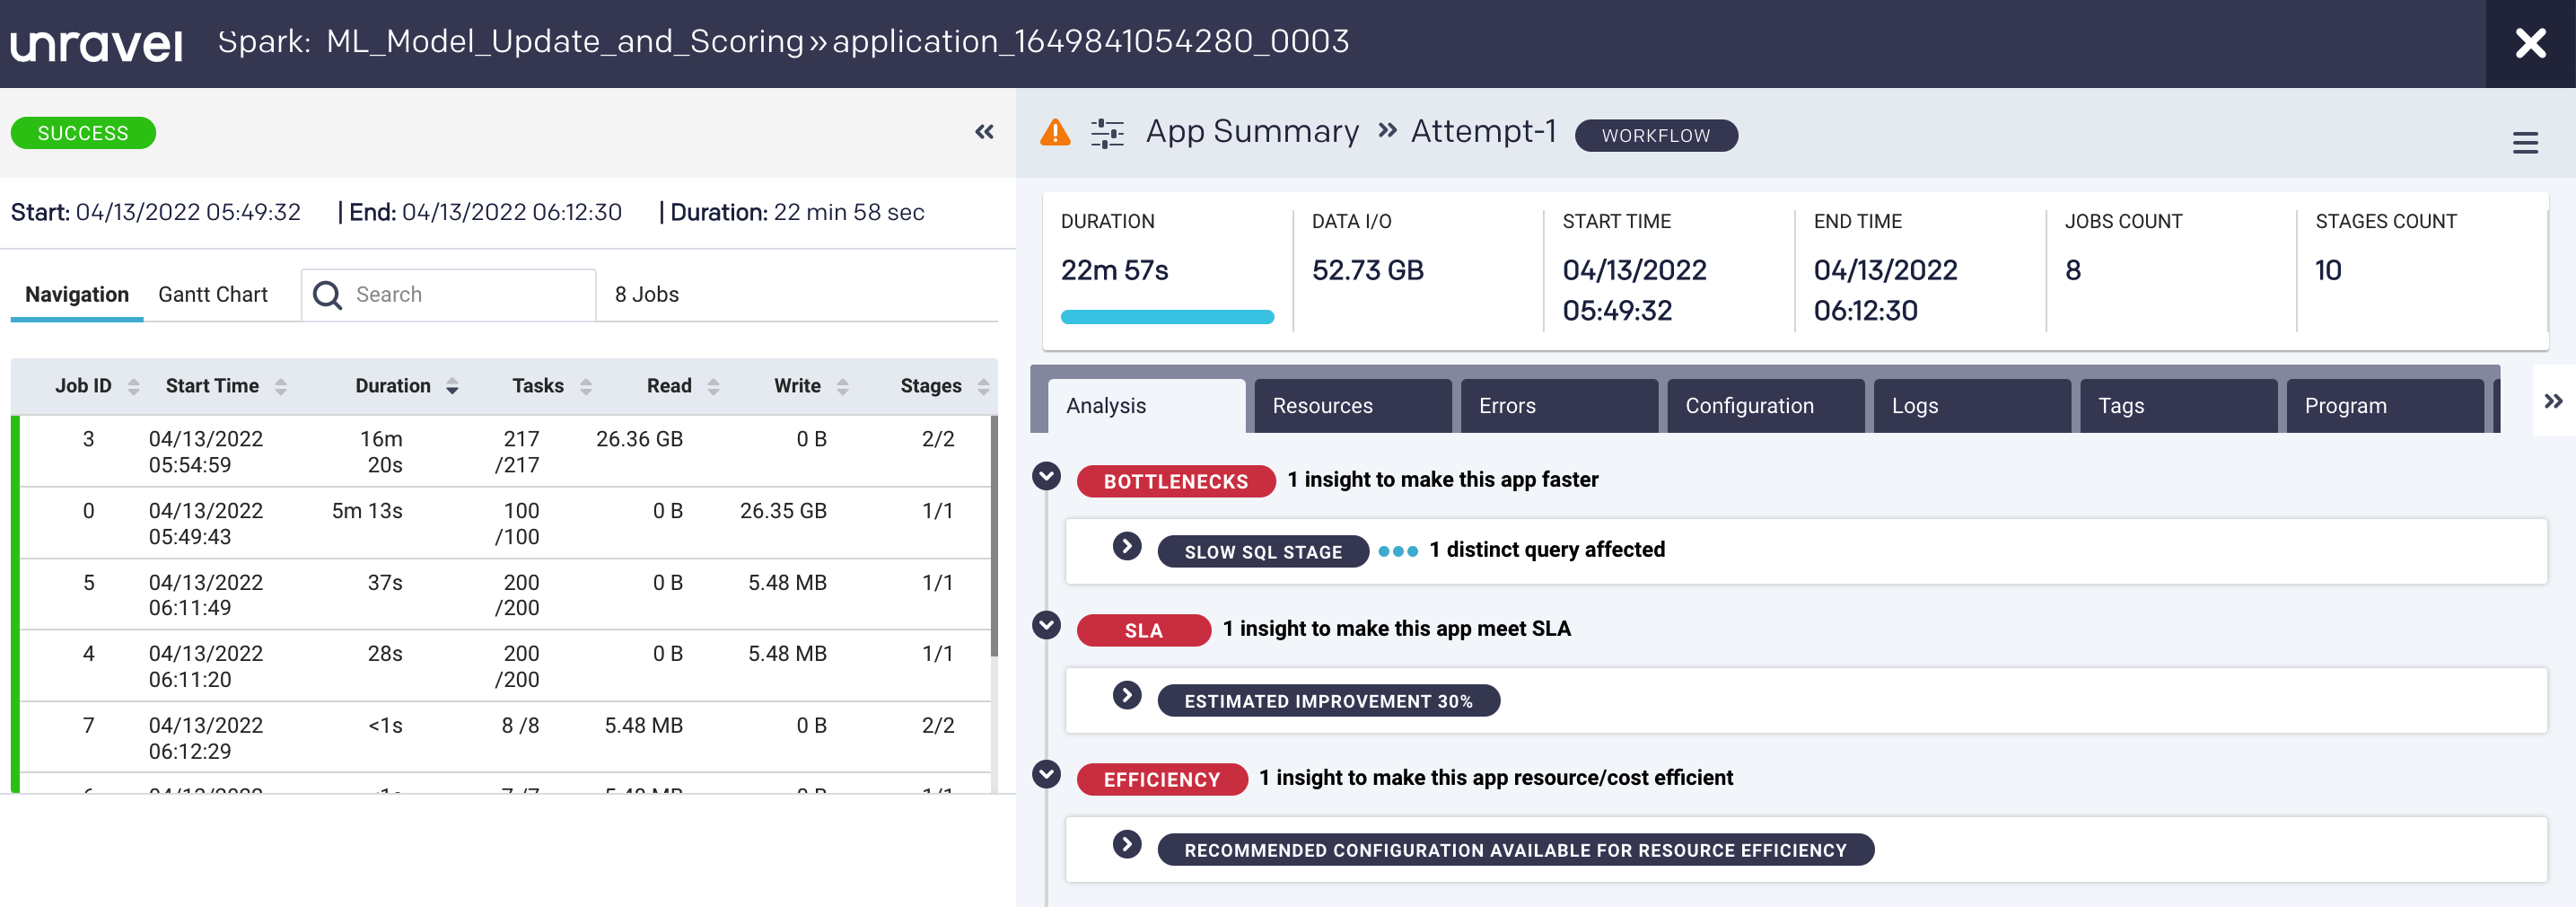
In this case, observability shows you that while the application completed successfully, it took almost 23 minutes (22m 57s)—violating the SLA of 20 minutes. Here, Unravel takes you to the exact spot in the complex pipeline shown earlier and, on the left, has pulled together granular details about the various jobs processing in parallel. You can toggle on a Gantt chart view to get a better view of the degree of parallelism:
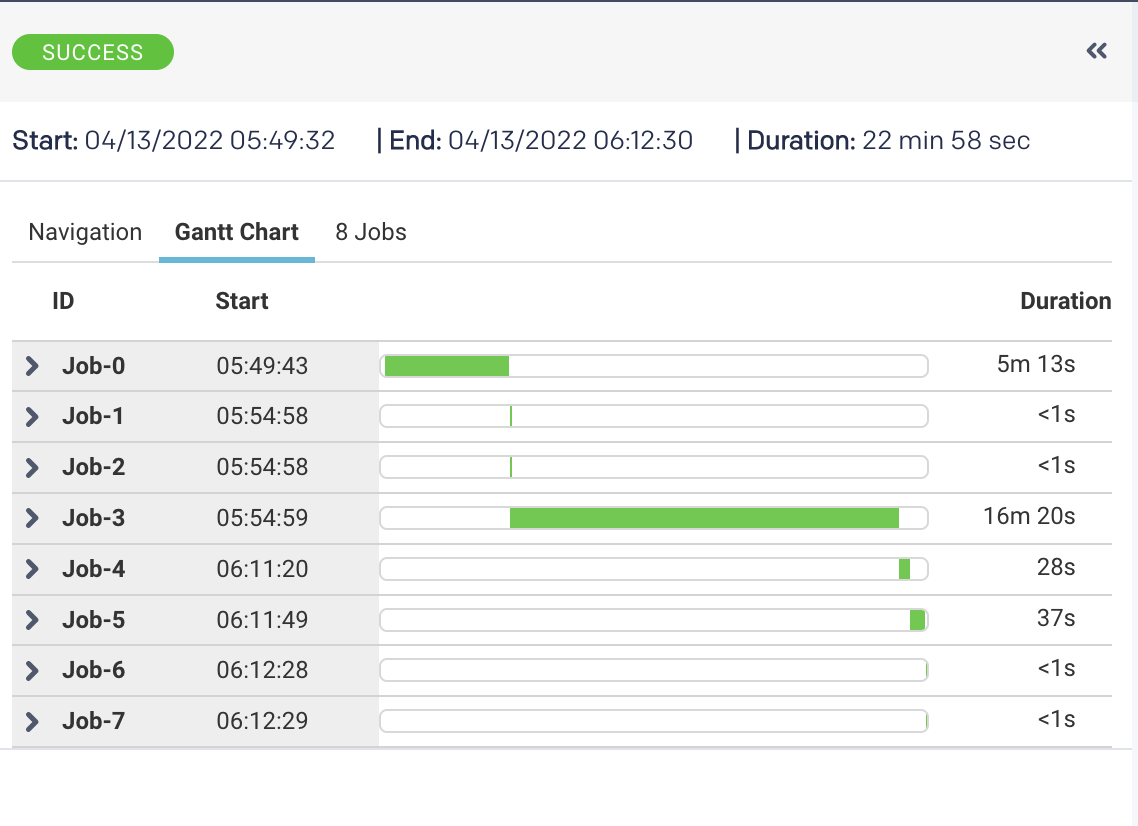
A Gantt chart view breaks down all the individual jobs and sub-tasks processing in parallel
So now you know what caused the pipeline to miss the SLA and where it happened (jobs #0 and #3), but you don’t know why. You’ve saved a lot of investigation time—you get the relevant data in minutes, not hours—and can be confident that you haven’t missed anything, but you still need to do some detective work to analyze the information and figure out what went wrong.
Optimization tells you “why”—and what to do about it
The better observability tools also point out, based on patterns, things you should pay attention to—or areas you don’t need to investigate. By applying machine learning and statistical algorithms, it essentially throws some math at the correlated data to identify significant patterns—what’s changed, what hasn’t, what’s different. This pipeline runs regularly; why was it slow this time? It’s the same kind of analysis a human expert would do, only done automatically with the help of ML and statistical algorithms.
While it would certainly be helpful to get some generalized insight into why the pipeline slowed—it’s a memory issue—what you really need to know is what to do about it.
AI-enabled observability goes beyond telling you what happened and why, to pinpointing the root cause and providing recommendations on exactly what you need to do to fix it.
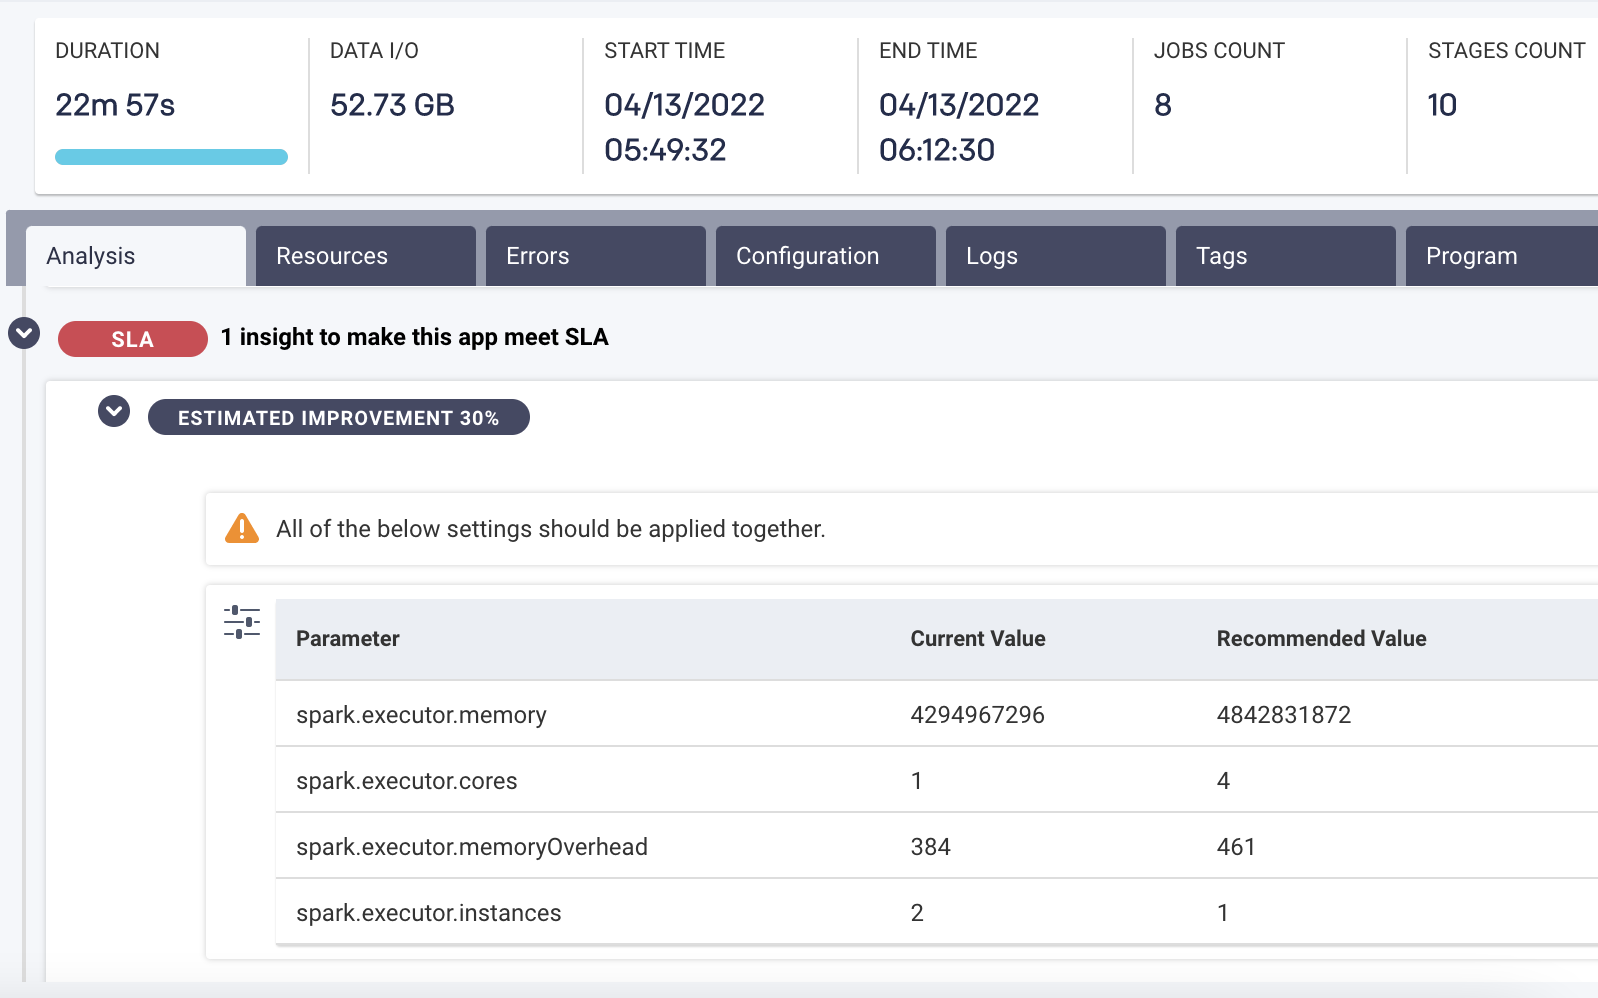
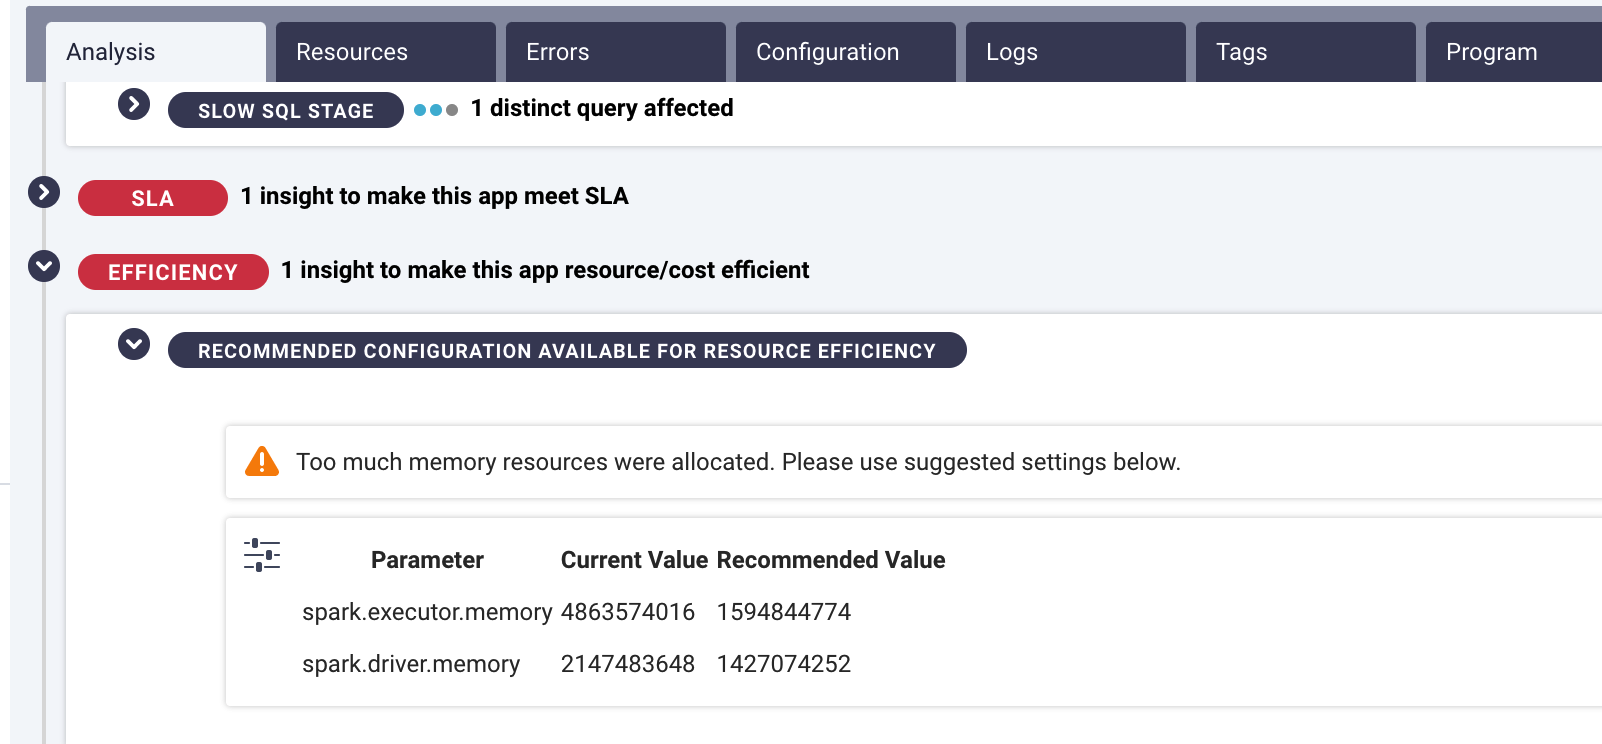
AI-driven recommendations pinpoint exactly where—and how—to optimize (click on image to expand)
AI-driven recommendations provide specific configuration parameters that need to be applied in order for the pipeline to run faster and meet the 20-minute SLA. After the AI recommendations are implemented, we can see that the pipeline now runs in under 11 minutes—a far cry from the almost 23 minutes before.
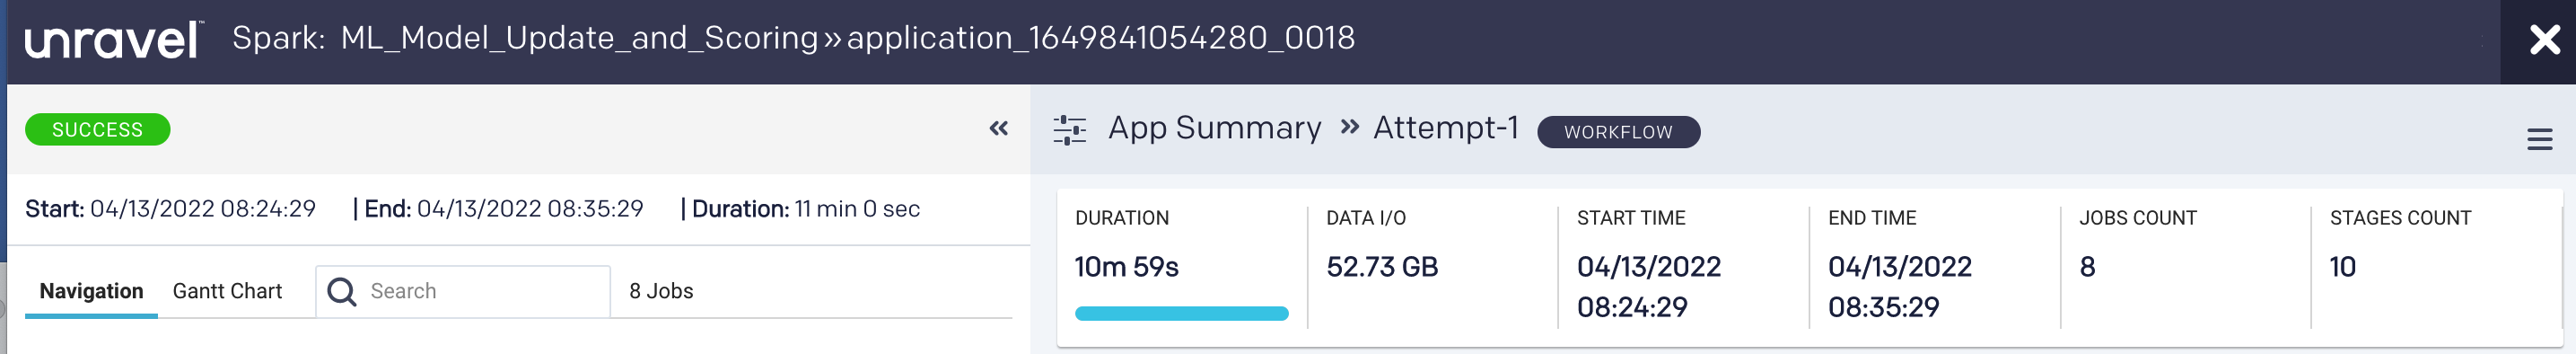
AI recommendations improved pipeline performance from 23m to <11m, now meeting its SLA
Too often getting to the point of actually fixing the problem is another time-consuming effort of trial and error. Actionable AI recommendations won’t fix things automatically for you—taking the action still requires human intervention—but all the Sherlock Holmes work is done for you. The fundamental questions of what went wrong, why, and what to do about it are answered automatically.
Beyond optimizing performance, AI recommendations can also identify where cost could be improved. Say your pipeline is completing within your SLA commitments, but you’re spending much more on cloud resources than you need to. An AI engine can determine how many or what size containers you actually need to run each individual component of the job—vs. what you currently have configured. Most enterprises soon realize that they’re overspending by as much as 50%.
Create a free account
Governance helps avoid problems in the first place
These capabilities save a ton of time and money, but they’re still relatively reactive. What every enterprise wants is a more proactive approach to making their data applications and pipelines run better, faster, cheaper. Spend less time firefighting because there was no fire to put out. The system itself would understand that the memory configurations were insufficient and automatically take action so that pipeline performance would meet the SLA.
For a whole class of data application problems, this is already happening. AI-powered recommendations and insights lay the groundwork for putting in place some automated governance policies that take action on your behalf.
Governance is really all about converting the AI recommendations and insights into impact. In other words, have the system run automatic responses that implement fixes and remediations for you. No human intervention is needed. Instead of reviewing the AI recommendation and then pulling the trigger, have the system apply the recommendation automatically.

Automated alerts proactively identify SLA violations
Policy-based governance rules could be as benign as sending an alert to the user if the data table exceeds a certain size threshold or as aggressive as automatically requesting a configuration change for a container with more memory.
This is true AIOps. You don’t have to wait until after the fact to address an issue or perpetually scan the horizon for emerging problems. The system applies AI/ML to all the telemetry data extracted and correlated from everywhere in your modern data stack to not only tell you what went wrong, why, and what to do about it, but it predicts and prevents problems altogether without any human having to touch a thing.