


In a previous blog and webinar, my colleague Eric Chu discussed Unravel’s powerful recommendation capabilities in the Hive on MapReduce setting. To recap briefly, for these Hive on MR applications, Unravel surfaced inefficiencies and associated performance problems associated with the excessive number of mapper and reducer tasks being spawned to physically execute the query.
In this article, we’ll focus on another execution engine for Hive queries, Apache Tez. Tez provides a DAG-based model for physical execution of Hive queries and ships with Hortonworks’s HDP distribution as well as Amazon EMR.
We’ll see that reducing the number of tasks is an important optimization in this setting as well, however, it’s important to note that Tez makes use of a different mechanism for input splits, which means different parameters must be tuned. Of course, Unravel simplifies this nuance by directly recommending efficient settings for the Tez-specific parameters in play, using our ML/AI-informed infrastructure monitoring tools.
Before diving into some hands-on tuning from a data engineer’s point-of-view, I want to note that there are many factors that can lead to variability in execution performance and resource consumption of Hive on Tez queries.
Once Unravel’s intelligent APM functionality provides deep insights into the nature of multi-tenant workloads running in modern data stack environments, operators can rapidly identify the causes of this variability, which could include:
- Data skew
- Resource contention
- Changes in volume of processed data
Towards the end of this blog, we will highlight some of the operator-centric features in Unravel, providing full fidelity visibility that can be leveraged to yield such insights.
We’ll use the following TPC-DS query on an HDP 2.6.3 cluster.

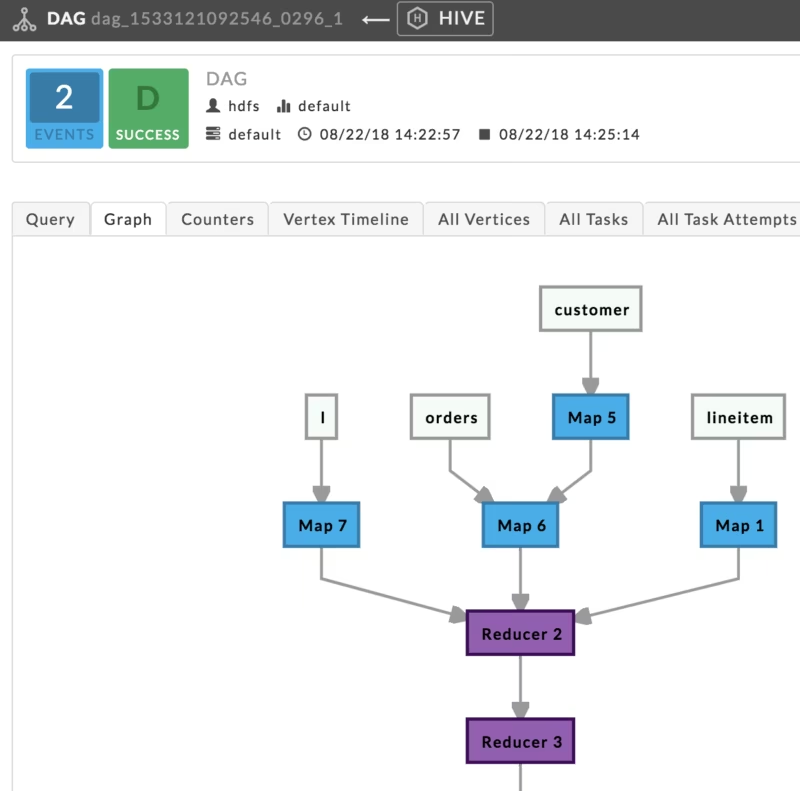
When we execute a query of this form with aggregation, sort, and limit semantics, we can see that the Map-Reduce-Reduce pattern is used by Tez which is a nice improvement over the MR execution engine, as this pattern isn’t possible in pure MapReduce.
As discussed above and in Eric’s aforementioned blog, there is a balancing act in distributed processing that must be maintained between the degree of parallelism of the processing and how much work is being completed by each parallel process. Tez attempts to achieve this balance via the grouping of splits. The task parallelism in Tez is determined by the grouping algorithm discussed here.
The key thing to note is that the number of splits per task must be aligned with the configuration settings for tez.grouping.min-size and tez.grouping.max-size.
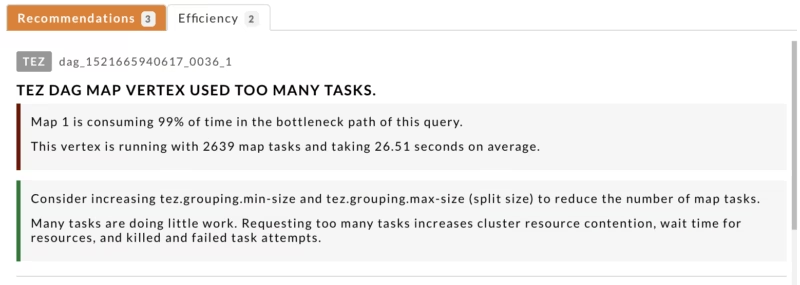
Unravel first recommends tuning of these grouped splits in order for the cluster to allocate a smaller number of Tez map tasks, in order to gain better throughput with each task processing a larger amount of data relative to the pre-tuned execution.

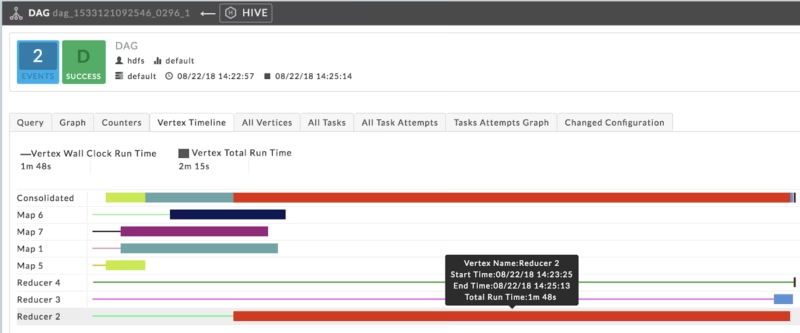
Returning to the Map-Reduce-Reduce DAG that the optimizer identified for this query, we see that the first reducer stage is taking a long time to process.
At this point, without Unravel, a data engineer would usually dig into the physical execution plan, in order to identify how much data each reducer task is processing. Next, the engineer would need to understand how to properly configure the number of reducers to yield better efficiency and performance.
This is non-trivial, given the number of parameters in play: hive.tez.auto.reducer.parallelism, hive.tez.min.partition.factor, hive.tez.max.partition.factor, hive.exec.reducers.max, and hive.exec.reducers.bytes.per.reducer, and more (take a look at the number of Tez configuration parameters available, a large number of which can affect performance).
In fact, with auto reducer parallelism turned on (the default in HDP), Tez samples the source vertices’ output sizes and adjusts the number of reducer tasks dynamically. When there is a large volume of input data, but the reducer stage output is small relative to this input, the default heuristics can lead to too few reducers.
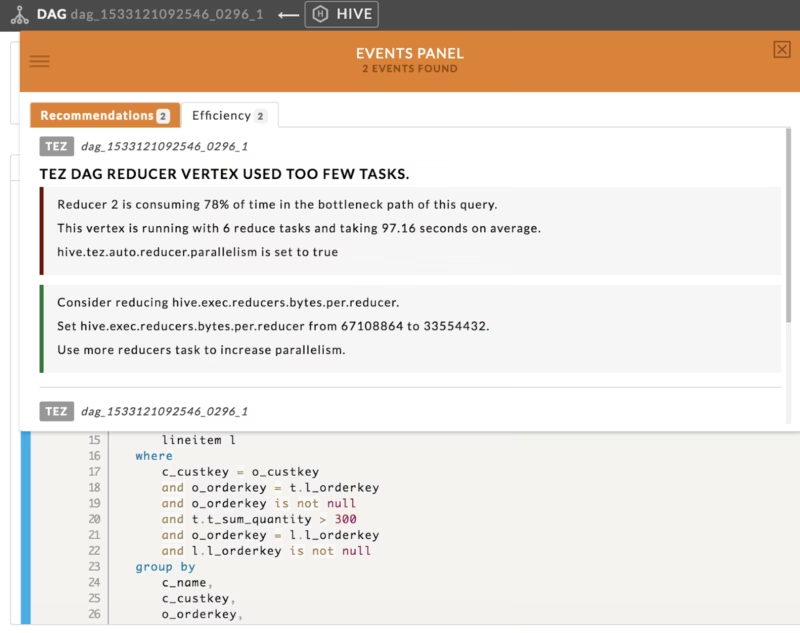
This is a good example of the subtleties that can arise with performance tuning–in the Hive on MR case, we had a query that was using way too many reducer tasks, leading to inefficiencies. In this case, we have a query using too few reducer tasks. Furthermore, even more reducers does not necessarily mean better performance in this case either!
In fact, in further testing, we found that tuning hive.exec.reducers.bytes.per.reducer to a somewhat higher value, resulting in less reducers, can squeeze out a bit better performance in this case.
As we discussed, it’s a complex balancing act to play with the number of tasks processing data in parallel and the amount of data being processed by each. Savvy data engineers spend an inordinate amount of time running experiments in order to hand-tune these parameters before deploying their applications to Production.
How Unravel Helps Auto-Tuning Tez Applications
Fortunately, with Unravel, we have a lot less work to do as data engineers. Unravel intelligently navigates this complex response surface using machine learning algorithms, to identify and surface optimal configurations automatically. It’s up to you how to optimize your output, using the full-stack infrastructure monitoring tools provided.
Let’s move on to the operator-centric point-of-view in Unravel to briefly discuss the insights we can gain when we determine there is considerable variability in the efficiency and performance of our Tez applications.
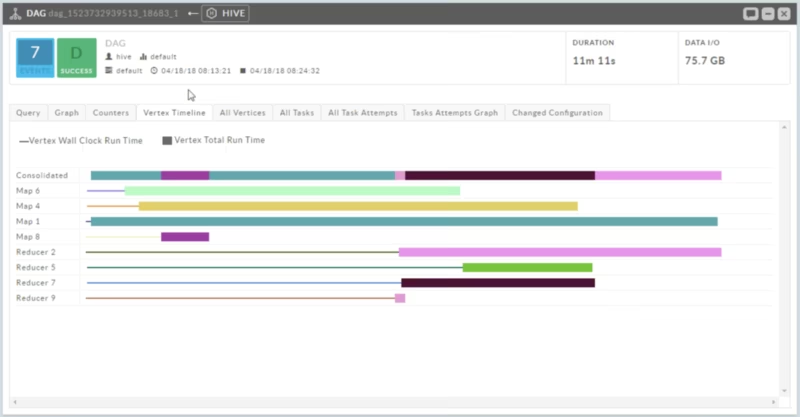
The first item we identified is data skew, how can we use Unravel to identify this issue? First, we can quickly see the total run time broken down by Tez task this in the vertex timeline:
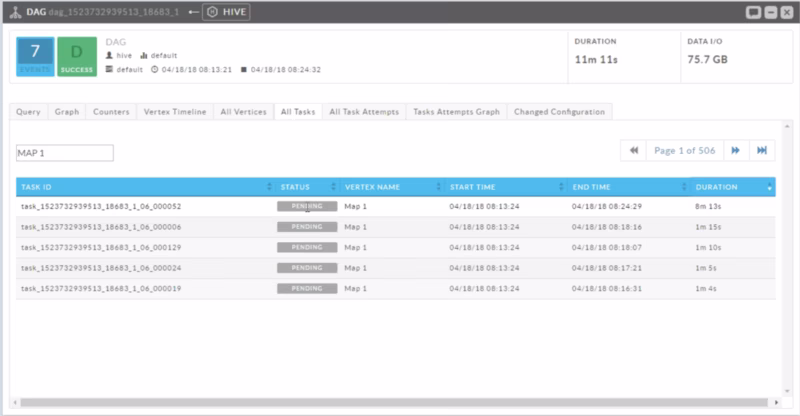
Secondly, we have a sortable cross-table we can leverage to easily see which tasks took the longest.
This can be the result of processing skew or data skew, and Unravel provides some additional histograms to provide insights into this. These histograms bucket the individual tasks by duration and by processed I/O.

Non-uniformity of the distribution of these tasks yields insights into the nature of the skew which cluster operators and developers can leverage to take actionable tuning and troubleshooting steps.
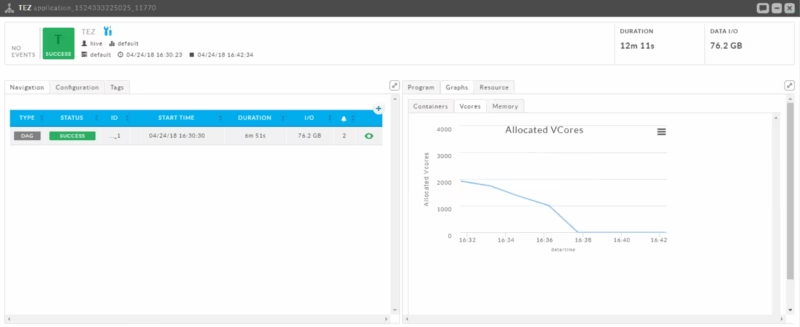
Fantastic, how about resource contention? First, we can take a look at an app that executed quickly because it was allocated all of its requested containers by YARN right away:
Our second figure shows what can occur when there are other tenants within the cluster requesting containers for their applications, the slower execution is due to waiting for containers from the Resource Manager:

Finally, as far as changes in input data volume, we can make use of Unravel’s powerful Workflow functionality in this context in order to determine when this changes considerably, leading to variances in application behavior. In a future blog, we will discuss techniques to address this concern.
If you want to know more about Unravel Data, you can get a free health check report to unlock your data environment or contact us.