

Table of Contents
Improve performance of Hadoop jobs
Unravel Data can help improve the performance of your Spark and Hadoop jobs by up to 5x. The Unravel platform can help drive this performance improvement in several ways, including:
- Save resources by reducing the number of tasks for queries
- Drastically speed up queries
- Removing the reliance of using default configurations
- Recommending optimized configurations that minimizes the number of tasks
- Automatically detect problems and suggest optimum values
Let’s look at a real-world example from an Unravel customer.
Too many tasks, too many problems
We recently heard from a customer who was experiencing performance issues and by using Unravel, he was able to speed up his query from 41 minutes to approximately 8 minutes. He did this by using our automatic inefficiency diagnoses and implementing the suggested fixes.
The Unravel platform identified that a number of this customer’s queries were using way more tasks than were needed. This problem is not unique to his application.
When running big data applications, we often find the following common pitfalls:
- Using too many tasks for a query increases the overhead
- Increased wait time for resource allocation
- Increased duration of the query
- Resource contention at the cluster level affects concurrent queries
The result after fine-tuning the Hadoop jobs with Unravel
In this case, the customer was able to fine-tune their queries based on Unravel’s suggestions and see a 5x speed improvement by using only one-tenth of the original number of tasks.
Let’s look at this example in more detail to review the problems facing this customer and how Unravel helped resolve it. Our examples will be Hive with MapReduce applications running on a YARN cluster as this is what the customer was using, but the problem is applicable in other types of YARN applications such as Spark and Hive with Tez, which Unravel supports also.
Customer Experience
The Hive query in this customer example took 40 minutes on average to complete and could take longer (more than 1 hour) or less (about 29 min) depending on how busy the cluster was. To note, he did not make changes to any YARN, Hive, MapReduce configurations for these runs, so the configurations were from the default setting for the cluster.
After installing Unravel, he saw that for this query, Unravel automatically detected that it was using too many map and reduce tasks (Figures 1 and 2). Moreover, it provided actionable suggestions to improve the inefficiency – it specified new values for the configurations mapreduce.input.fileinputformat.split.minsize, mapreduce.input.fileinputformat.split.maxsize, and hive.exec.reducers.bytes.per.reducer, that would result in fewer map and reduce tasks in a future run.
Significant improvements were seen immediately after using the new configurations. As shown in Q1 in Table 1, the number of tasks used by the query dropped from 4368 to 407, while query duration went down from 41 minutes 18 seconds to 8 minutes 2 seconds. Three other queries in this workload were also flagged by Unravel for using too many tasks. The user proceeded to use the settings recommended for these queries and got significant improvements in both resource efficiency and speedup.
Q2 to Q4 in Table 1 show the results. We could see that for all of the queries, the new runs used approximately one-tenth of the original number of tasks, but achieved a query speedup of 2 to 5X. It is also worth noting that the significant reduction in tasks by these queries freed up resources for other jobs to run on the cluster, thereby improving the overall throughput of the cluster.
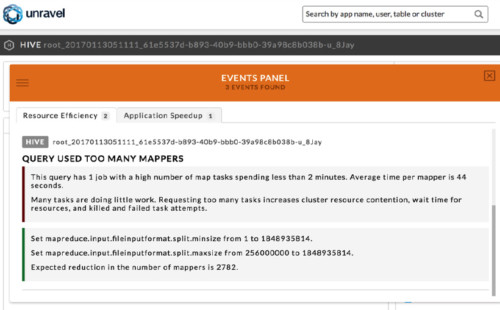
Figure 1. Query used too many mappers. Unravel shows that this query has one job using too many map tasks, and provides a recommendation for the configurations mapreduce.input.fileinputformat.split.minsize and mapreduce.input.fileinputformat.split.maxsize to use fewer number of map tasks in the next run.
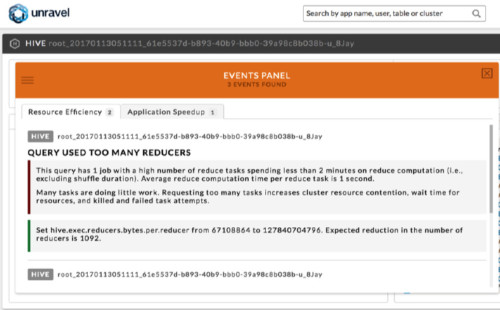
Figure 2. Query used too many reducers. Unravel shows that this query has one job using too many reduce tasks, and provides a recommendation for the configuration hive.exec.reducers.bytes.per.reducer to use reduce tasks in the next run.
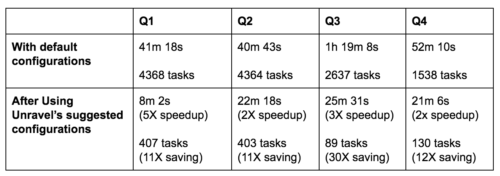
Table 1. The duration and tasks used before and after using Unravel’s suggested configurations.
Detecting and Mitigating Too Many Tasks in Spark and Hadoop jobs
Unravel analyzes every application running on the cluster for various types of inefficiencies. To determine whether a query is using too many tasks, Unravel checks your Spark and Hadoop jobs to see if a larger number of its tasks process too little data per task.
As shown in Figures 1 and 2, Unravel explained that a majority of the tasks ran for too little time (average map time is 44 seconds and average reduce computation time is 1 second). Figure 3 provides another view of the symptom. We see that all 3265 map tasks finished in less than 2 minutes, and most of them processed between 200 and 250 MB of data. On the reduce side, more than 1000 reduce tasks finished in less than 1.5 minutes, and most of them processed less than 100 KB of data each.
Upon detecting the inefficiency, Unravel automatically computes new configuration values that users can use to get fewer tasks for a future run. Contrasting Figure 3, Figure 4 shows the same histograms for the run with new configurations. This time there were only 395 map tasks, an 8X reduction, and most of them took longer than 2 minutes (though all of them still finished within 3.5 minutes) and processed between 2 and 2.5 GB of data. On the reduce side, only 8 reduce tasks were used, and each processed between 500 and 800 KB. Most importantly, the job duration went from 39 minutes 37 seconds to 7 minutes 11 seconds.
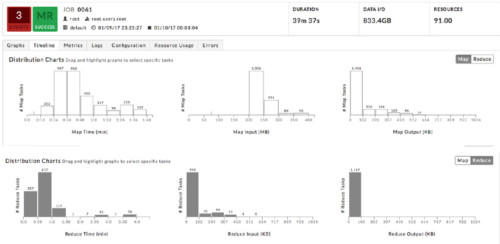
Figure 3. Histograms showing the distribution of map and reduce task duration, input, and output size. More than 3000 map tasks and more than 1000 reduce tasks are allocated for this job, which took almost 40 minutes, but each task runs for very little time.
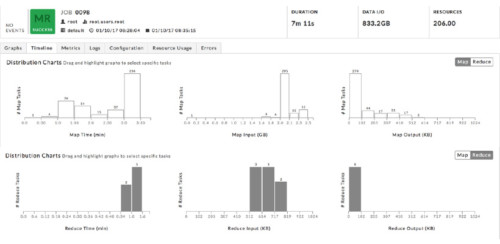
Figure 4. Drastic reduction in job duration with fewer tasks processing more data per task. Fewer than 400 map tasks and only 8 reduce tasks were allocated to do the same amount of work in the new run. The job finished in just over 7 minutes.
How Using Fewer Tasks Improves Query Speedup for Spark and Hadoop jobs
Several reasons explain why using fewer tasks resulted in shorter duration, not longer as many might expect. First, in the original run, a larger number of tasks were allocated but each task processed very little data. Allocating and starting a task incurs an overhead, but this overhead is about the same whether a task ends up processing 100KB or 1GB of data. Therefore, using 1000 tasks to process 100GB, with each task processing 0.1GB, would have a much larger overhead than doing the same with 100 tasks, with each task processing 1GB.
Second, there is a limit to how many containers an application can get at a time. Not only does the cluster have limited resources, but also it is typically multi-tenant, so concurrent applications have to share (fight for) containers – recall that the query with the default configuration could vary in duration from 29 minutes to more than an hour depending on how busy the cluster was.
Suppose a query needs 200 containers but only 100 are available at the time. The query will get the 100 containers, and will wait till resources become available for the other 100. Often, this means it will have to wait until its first 100 containers are finished, freed, and allocated again for the second “wave” of the 100 containers. Therefore, requesting fewer tasks means that it is faster to get all the tasks needed.
Third, the default configurations often result in too many tasks for many applications. Unfortunately, most users submit applications with the default configurations because they may not know that resources can be tuned, or which parameters to tune. Savvier users who know which parameters to tune may try to change them, often arbitrarily and through trial and error, but this process takes a long time because they do not know what values to set.
This is where Unravel shines – in addition to detecting an inefficiency, it can tell users what configurations to change, and what values to set to improve the inefficiency. In fact, besides the post-query analysis that I discussed in this post, Unravel can detect issues when the query is still running, and users can configure rules to automatically take predefined actions when a problem is detected. We will discuss that further in a future post.