

Summary: Sometimes the insight you’re shown isn’t the one you were expecting. Unravel DataOps observability provides the right, and actionable, insights to unlock the full value and potential of your Spark application.
One of the key features of Unravel is our automated insights. This is the feature where Unravel analyzes the finished Spark job and then presents its findings to the user. Sometimes those findings can be layered and not exactly what you expect.
Why Apache Spark Optimization?
Let’s take a scenario where you are developing a new Spark job and doing some testing. The goal of this testing is to ensure the Spark application is properly optimized. You want to see if you have tuned it appropriately so you bump up the resource allocation really high. The goal being you want to see if Unravel shows a “Container Sizing” event, or something along those lines. Instead of seeing a “Container Sizing” event there are a few others, in our case “Contended Driver” and “Long Idle Time for Executors” events. Let’s take a look at why this might be the case!
Recommendations to optimize Spark
When Unravel presents recommendations it presents them based on what is most helpful for the current state of the application. It will also only present the best case, when it can, for improving the applications. In certain scenarios this will lead to Insights that are not shown because they would end up causing more harm than good. There can be many reasons for this, but let’s take a look at how Unravel is presenting this particular application.
Below are the resource utilization graphs for the two runs of the application we are developing:
Original run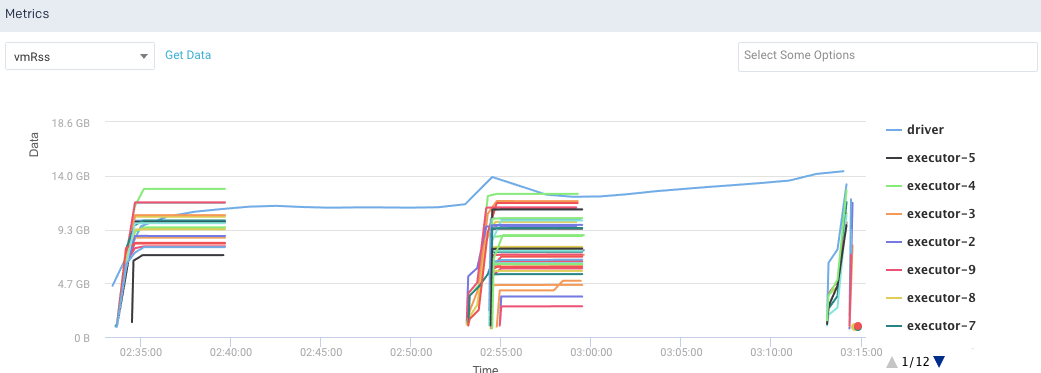
New Run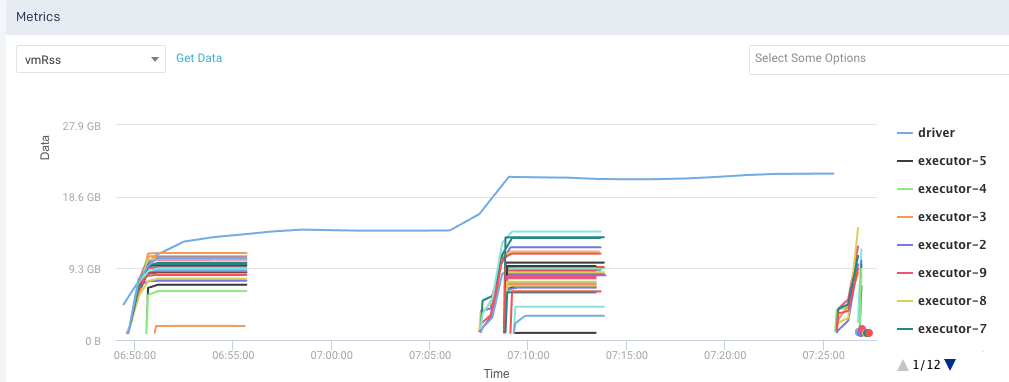
The most glaring issue is this idle time. We can see the job is doing bursts of work and then just sitting around doing nothing. If the idle time was looked at from an application perspective then it would help improve the jobs performance tremendously. This is most likely masking other potential performance improvements. If we dig into the job a bit further we can see this: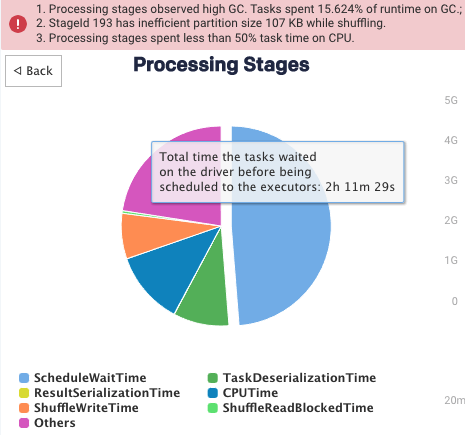
The above is a breakdown of what the job was doing for the whole time. Nearly 50% was spent on ScheduledWaitTime! This leads to the Executor idle time recommendation: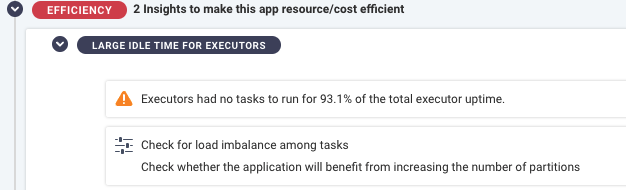
Taking all of the above information we can see that the application was coded in such a way that it’s waiting around for something for a while. At this point you could hop into the “Program” tab within Unravel to take a look at the actual source code associated with this application. We can say the same thing about the Contended Driver: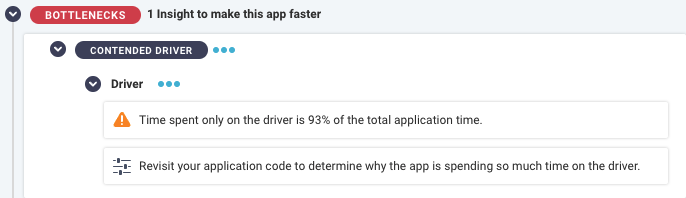
With this one we should examine why the code is spending so much time with the driver. It goes hand-in-hand with the idle time because while the executors are idle, the driver is still working away. Once we take a look at our code and resolve these two items, we would see a huge increase in this job’s performance!
Another item which was surfaced when looking at this job was this:
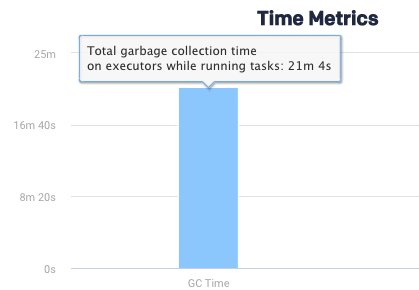
This is telling us that the Java processes spent a lot of time in garbage collection. This can lead to thrashing and other types of issues. More than likely it’s related to the recommendations Unravel made that need to be examined more deeply.
With all of the recommendations we saw we didn’t see the expected resource recommendations. That is because Unravel is presenting the most important insights. Unravel is presenting the right things that the developer needs to look at.
These issues are deeper than settings changes. An interesting point is that both jobs we looked at required some resource tuning. We could see that even the original job was overallocated. The problem with these jobs though is showing just the setting changes isn’t the whole story.
If Unravel just presented the resource change and those were implemented it might lead to the job failing; for example being killed by the JVM because of garbage collection issues. Unravel is attempting to steer the developer in the right direction and give them the tools they need to determine where the issue is in their code. If they fix the larger issues, like high GC or contended driver, then they will start being able to really tune and optimize their job.
Next steps:
Unravel is a purpose-built observability platform that helps you stop firefighting issues, control costs, and run faster data pipelines. What does that mean for you?
- Never worry about monitoring and observing your entire data estate.
- Reduce unnecessary cloud costs and the DataOps team’s application tuning burden.
- Avoid downtime, missed SLAs, and business risk with end-to-end observability and cost governance over your modern data stack.
How can you get started?
Get a free health check report to unlock your data environment.
Book a demo to see how Unravel simplifies modern data stack management.