

Why Data Pipelines Become Complex
Companies across a multitude of industries, including entertainment, finance, transportation, and healthcare, are on their way to becoming data companies. These companies are creating advanced data products with insights generated using data pipelines. To build data pipelines, you need a modern stack that involves a variety of systems, such as Airflow for orchestration, Snowflake or Redshift as the data warehouse, Databricks and Presto for advanced analytics on a data lake, and Kafka and Spark Streaming to process data in real-time, just to name a few. Combining all these systems naturally causes your data pipelines to become complex, however. In this talk, Shivnath shares a recipe for dealing with this complexity and keeping your data pipelines healthy.
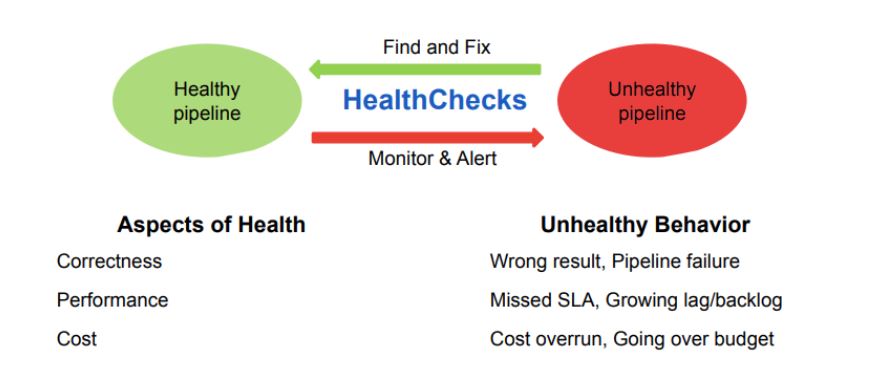
What Is a Healthy Data Pipeline?
Pipeline health can be viewed along three dimensions: correctness, performance, and cost. To understand pipeline health, Shivnath described what an unhealthy pipeline would look like along the three dimensions.
In this presentation, Shivnath not only shares tips and tricks to monitor the health of your pipelines, and to give you confidence that your pipelines are healthy, but he also shares ways to troubleshoot and fix problems that may arise if and when pipelines fall ill.
HealthCheck for Data Pipelines
Correctness
Users cannot be expected to write and define all health checks, however. For example, a user may not define a check because the check is implicit. But if this check is not evaluated, a false negative can arise, meaning that your pipeline might generate incorrect results that will be hard to resolve. Luckily, you can avoid this problem by having a system that runs automatic checks – for example, automatically detecting anomalies or changes. It is important to note, however, that automatic checks can instead induce false positives. Balancing false positives and false negatives remains a challenge today. A good practice is to design your checks in parallel with designing the pipeline.
But what do you do when these checks fail? Of course you have to troubleshoot the problem and fix it, but it is also important to capture failed checks in the context of the pipeline execution. There are two reasons why. One, the root cause of the failure may lie upstream in the pipeline, so you must understand the lineage of the pipeline. And two, a lot of checks fail because of changes in your pipeline. Having a history of these pipeline runs is key to understanding what has changed.
Performance
Shivnath has some good news for you; performance checks involve less context and application semantics compared to correctness checks. The best practice for performance checks is to define end-to-end performance checks in the form of pipeline SLAs. You can also define checks at different stages of the pipeline. For example, with Airflow you can easily specify the maximum time a task can take and define a check at that time. Automatic checks for performance are useful because the users don’t have to specify all the checks, just as with correctness checks. Again, keeping in mind the caveat about false positives and false negatives, it is critical but easy to build the appropriate baselines and detect deviations from these baselines though pipeline runs.
The timing of checks is also important. For example, it probably wouldn’t be helpful if a check fails after the pipeline SLA was missed. A best practice is to keep pipeline stages short and frequent so checks can also be seen and evaluated often.
When it comes to troubleshooting and tuning, Shivnath notes that it is important to have what he calls a “single pane of glass”. Pipelines can be complex with many moving parts, so having an end-to-end view is very important to troubleshoot problems. For example, due to multi-tenancy, an app that is otherwise unrelated to your pipeline may affect your pipeline’s performance. This is another example of where having automatic insights about what caused a problem is vital.
Cost
Just like performance checks, HealthChecks for cost also require less context and application semantics compared to correctness checks. But when it comes to cost checks, early detection is especially important. If a check is not executed, or a failed check is not fixed, and as a result there is a cost overrun, there can be severe consequences. So it’s very important to troubleshoot and fix problems as soon as checks fail.
Costs can be incurred in many different ways, including cost of storage or cost of compute. Therefore, a single pane of glass is again useful, as well as a detailed cost breakdown. Lastly, automated insights to remediate problems are also critical.
HealthCheck Demos
After Shivnath describes the different kinds of HealthChecks and the impact they have on helping you monitor and track your pipelines, he demos a couple different scenarios where HealthChecks fail – first at the performance level, then at the cost level, and lastly at the correctness level.
That was a short demo of how HealthChecks can make it very easy to manage complex pipelines. And this blog just gives you a taste of how HealthChecks can help you find and fix problems, as well as streamline your pipelines. You can view Shivnath’s full session from Airflow Summit 2021 here. If you want to know more about Unravel Data, you can get a free health check report to unlock your data environment or contact us.