


Spark has become one of the most important tools for processing data – especially non-relational data – and deriving value from it. And Spark serves as a platform for the creation and delivery of analytics, AI, and machine learning applications, among others. But troubleshooting Spark applications is hard – and we’re here to help.
In this blog post, we’ll describe ten challenges that arise frequently in troubleshooting Spark applications. We’ll start with issues at the job level, encountered by most people on the data team – operations people/administrators, data engineers, and data scientists, as well as analysts. Then, we’ll look at problems that apply across a cluster. These problems are usually handled by operations people/administrators and data engineers.
For more on Spark and its use, please see this piece in Infoworld. And for more depth about the problems that arise in creating and running Spark jobs, at both the job level and the cluster level, please see the links below.
Five Reasons Why Troubleshooting Spark Applications is Hard
Some of the things that make Spark great also make it hard to troubleshoot. Here are some key Spark features, and some of the issues that arise in relation to them:
Memory-resident
Spark gets much of its speed and power by using memory, rather than disk, for interim storage of source data and results. However, this can cost a lot of resources and money, which is especially visible in the cloud. It can also make it easy for jobs to crash due to lack of sufficient available memory. And it makes problems hard to diagnose – only traces written to disk survive after crashes.
Parallel processing
Spark takes your job and applies it, in parallel, to all the data partitions assigned to your job. (You specify the data partitions, another tough and important decision.) But when a processing workstream runs into trouble, it can be hard to find and understand the problem among the multiple workstreams running at once.
Variants
Spark is open source, so it can be tweaked and revised in innumerable ways. There are major differences between the Spark 1 series, Spark 2.x, and the newer Spark 3. And Spark works somewhat differently across platforms – on-premises; on cloud-specific platforms such as AWS EMR, Azure HDInsight, and Google Dataproc; and on Databricks, which is available across the major public clouds. Each variant offers some of its own challenges and a somewhat different set of tools for solving them.
Configuration options
Spark has hundreds of configuration options. And Spark interacts with the hardware and software environment it’s running in, each component of which has its own configuration options. Getting one or two critical settings right is hard; when several related settings have to be correct, guesswork becomes the norm, and over-allocation of resources, especially memory and CPUs (see below) becomes the safe strategy.
Trial and error approach
With so many configuration options, how to optimize? Well, if a job currently takes six hours, you can change one, or a few, options, and run it again. That takes six hours, plus or minus. Repeat this three or four times, and it’s the end of the week. You may have improved the configuration, but you probably won’t have exhausted the possibilities as to what the best settings are.
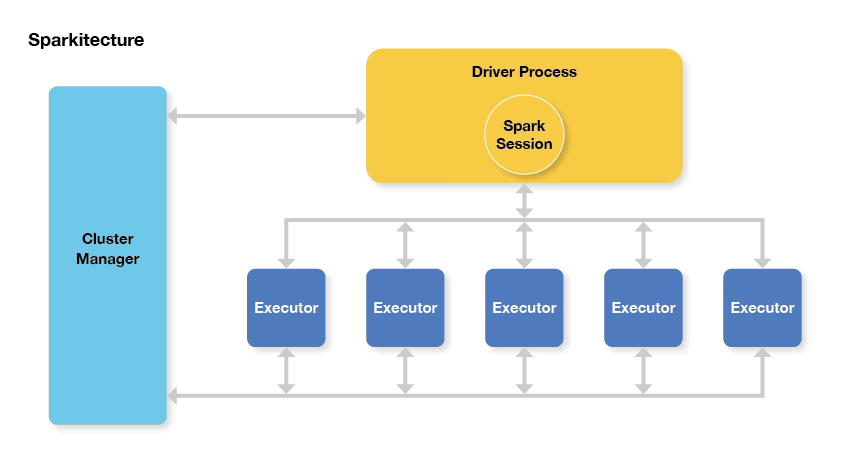
Sparkitecture diagram – the Spark application is the Driver Process, and the job is split up across executors. (Source: Apache Spark for the Impatient on DZone.)
Three Issues with Spark Jobs, On-Premises and in the Cloud
Spark jobs can require troubleshooting against three main kinds of issues:
- Failure. Spark jobs can simply fail. Sometimes a job will fail on one try, then work again after a restart. Just finding out that the job failed can be hard; finding out why can be harder. (Since the job is memory-resident, failure makes the evidence disappear.)
- Poor performance. A Spark job can run slower than you would like it to; slower than an external service level agreement (SLA); or slower than it would do if it were optimized. It’s very hard to know how long a job “should” take, or where to start in optimizing a job or a cluster.
- Excessive cost or resource use. The resource use or, especially in the cloud, the hard dollar cost of a job may raise concerns. As with performance, it’s hard to know how much the resource use and cost “should” be, until you put work into optimizing and see where you’ve gotten to.
All of the issues and challenges described here apply to Spark across all platforms, whether it’s running on-premises, in Amazon EMR, or on Databricks (across AWS, Azure, or GCP). However, there are a few subtle differences:
- Move to cloud. There is a big movement of big data workloads from on-premises (largely running Spark on Hadoop) to the cloud (largely running Spark on Amazon EMR or Databricks). Moving to cloud provides greater flexibility and faster time to market, as well as access to built-in services found on each platform.
- Move to on-premises. There is a small movement of workloads from the cloud back to on-premises environments. When a cloud workload “settles down,” such that flexibility is less important, then it may become significantly cheaper to run it on-premises instead.
- On-premises concerns. Resources (and costs) on-premises tend to be relatively fixed; there can be a leadtime of months to years to significantly expand on-premises resources. So the main concern on-premises is maximizing the existing estate: making more jobs run in existing resources, and getting jobs complete reliably and on-time, to maximize the pay-off from the existing estate.
- Cloud concerns. Resources in the cloud are flexible and “pay as you go” – but as you go, you pay. So the main concern in the cloud is managing costs. (As AWS puts it, “When running big data pipelines on the cloud, operational cost optimization is the name of the game.”) This concern increases because reliability concerns in the cloud can often be addressed by “throwing hardware at the problem” – increasing reliability but at a greater cost.
- On-premises Spark vs Amazon EMR. When moving to Amazon EMR, it’s easy to do a “lift and shift” from on-premises Spark to EMR. This saves time and money on the cloud migration effort, but any inefficiencies in the on-premises environment are reproduced in the cloud, increasing costs. It’s also fully possible to refactor before moving to EMR, just as with Databricks.
- On-premises Spark vs Databricks. When moving to Databricks, most companies take advantage of Databricks’ capabilities, such as ease of starting/shutting down clusters, and do at least some refactoring as part of the cloud migration effort. This costs time and money in the cloud migration effort, but results in lower costs and, potentially, greater reliability for the refactored job in the cloud.
All of these concerns are accompanied by a distinct lack of needed information. Companies often make crucial decisions – on-premises vs. cloud, EMR vs. Databricks, “lift and shift” vs. refactoring – with only guesses available as to what different options will cost in time, resources, and money.
The Biggest Spark Troubleshooting Challenges in 2024
Many Spark challenges relate to configuration, including the number of executors to assign, memory usage (at the driver level, and per executor), and what kind of hardware/machine instances to use. You make configuration choices per job, and also for the overall cluster in which jobs run, and these are interdependent – so things get complicated, fast.
Some challenges occur at the job level; these challenges are shared right across the data team. They include:
- How many executors should each job use?
- How much memory should I allocate for each job?
- How do I find and eliminate data skew?
- How do I make my pipelines work better?
- How do I know if a specific job is optimized?
Other challenges come up at the cluster level, or even at the stack level, as you decide what jobs to run on what clusters. These problems tend to be the remit of operations people and data engineers. They include:
- How do I size my nodes, and match them to the right servers/instance types?
- How do I see what’s going on across the Spark stack and apps?
- Is my data partitioned correctly for my SQL queries?
- When do I take advantage of auto-scaling?
- How do I get insights into jobs that have problems?
Section 1: Five Job-Level Challenges
These challenges occur at the level of individual jobs. Fixing them can be the responsibility of the developer or data scientist who created the job, or of operations people or data engineers who work on both individual jobs and at the cluster level.
However, job-level challenges, taken together, have massive implications for clusters, and for the entire data estate. One of our Unravel Data customers has undertaken a right-sizing program for resource-intensive jobs that has clawed back nearly half the space in their clusters, even though data processing volume and jobs in production have been increasing.
For these challenges, we’ll assume that the cluster your job is running in is relatively well-designed (see next section); that other jobs in the cluster are not resource hogs that will knock your job out of the running; and that you have the tools you need to troubleshoot individual jobs.
1. How many executors and cores should a job use?
One of the key advantages of Spark is parallelization – you run your job’s code against different data partitions in parallel workstreams, as in the diagram below. The number of workstreams that run at once is the number of executors, times the number of cores per executor. So how many executors should your job use, and how many cores per executor – that is, how many workstreams do you want running at once?
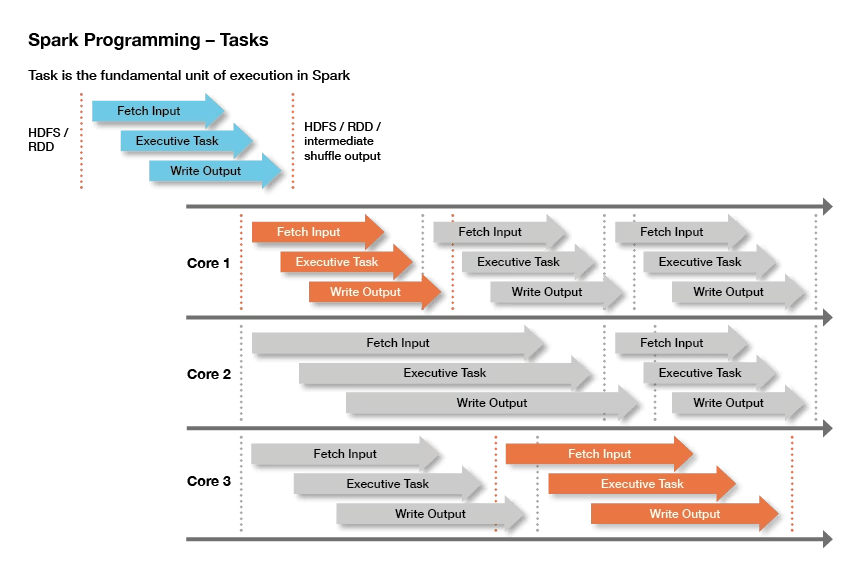
A Spark job uses three cores to parallelize output. Up to three tasks run simultaneously, and seven tasks are completed in a fixed period of time. (Source: Lisa Hua, Spark Overview, Slideshare.)
You want high usage of cores, high usage of memory per core, and data partitioning appropriate to the job. (Usually, partitioning on the field or fields you’re querying on.) This beginner’s guide for Hadoop suggests two-three cores per executor, but not more than five; this expert’s guide to Spark tuning on AWS suggests that you use three executors per node, with five cores per executor, as your starting point for all jobs. (!)
You are likely to have your own sensible starting point for your on-premises or cloud platform, the servers or instances available, and the experience your team has had with similar workloads. Once your job runs successfully a few times, you can either leave it alone or optimize it. We recommend that you optimize it, because optimization:
- Helps you save resources and money (not over-allocating)
- Helps prevent crashes, because you right-size the resources (not under-allocating)
- Helps you fix crashes fast, because allocations are roughly correct, and because you understand the job better
2. How much memory should I allocate for each job?
Memory allocation is per executor, and the most you can allocate is the total available in the node. If you’re in the cloud, this is governed by your instance type; on-premises, by your physical server or virtual machine. Some memory is needed for your cluster manager and system resources (16GB may be a typical amount), and the rest is available for jobs.
If you have three executors in a 128GB cluster, and 16GB is taken up by the cluster, that leaves 37GB per executor. However, a few GB will be required for executor overhead; the remainder is your per-executor memory. You will want to partition your data so it can be processed efficiently in the available memory.
This is just a starting point, however. You may need to be using a different instance type, or a different number of executors, to make the most efficient use of your node’s resources against the job you’re running. As with the number of executors (see the previous section), optimizing your job will help you know whether you are over- or under-allocating memory, reduce the likelihood of crashes, and get you ready for troubleshooting when the need arises.
For more on memory management, see this widely read article, Spark Memory Management, by our own Rishitesh Mishra.
3. How do I handle data skew and small files?
Data skew and small files are complementary problems. Data skew tends to describe large files – where one key-value, or a few, have a large share of the total data associated with them. This can force Spark, as it’s processing the data, to move data around in the cluster, which can slow down your task, cause low utilization of CPU capacity, and cause out-of-memory errors which abort your job. Several techniques for handling very large files which appear as a result of data skew are given in the popular article, Data Skew and Garbage Collection, by Rishitesh Mishra of Unravel.
Small files are partly the other end of data skew – a share of partitions will tend to be small. And Spark, since it is a parallel processing system, may generate many small files from parallel processes. Also, some processes you use, such as file compression, may cause a large number of small files to appear, causing inefficiencies. You may need to reduce parallelism (undercutting one of the advantages of Spark), repartition (an expensive operation you should minimize), or start adjusting your parameters, your data, or both (see details here).
Both data skew and small files incur a meta-problem that’s common across Spark – when a job slows down or crashes, how do you know what the problem was? We will mention this again, but it can be particularly difficult to know this for data-related problems, as an otherwise well-constructed job can have seemingly random slowdowns or halts, caused by hard-to-predict and hard-to-detect inconsistencies across different data sets.
4. How do I optimize at the pipeline level?
Spark pipelines are made up of dataframes, connected by transformers (which calculate new data from existing data), and Estimators. Pipelines are widely used for all sorts of processing, including extract, transform, and load (ETL) jobs and machine learning. Spark makes it easy to combine jobs into pipelines, but it does not make it easy to monitor and manage jobs at the pipeline level. So it’s easy for monitoring, managing, and optimizing pipelines to appear as an exponentially more difficult version of optimizing individual Spark jobs.
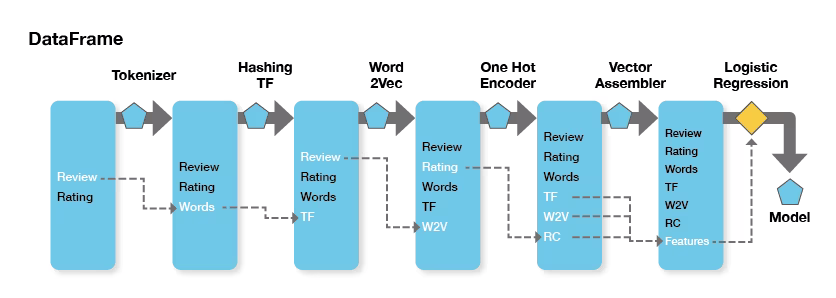
Existing Transformers create new Dataframes, with an Estimator producing the final model. (Source: Spark Pipelines: Elegant Yet Powerful, InsightDataScience.)
Many pipeline components are “tried and trusted” individually, and are thereby less likely to cause problems than new components you create yourself. However, interactions between pipeline steps can cause novel problems.
Just as job issues roll up to the cluster level, they also roll up to the pipeline level. Pipelines are increasingly the unit of work for DataOps, but it takes truly deep knowledge of your jobs and your cluster(s) for you to work effectively at the pipeline level. This article, which tackles the issues involved in some depth, describes pipeline debugging as an “art.”
5. How do I know if a specific job is optimized?
Neither Spark nor, for that matter, SQL is designed for ease of optimization. Spark comes with a monitoring and management interface, Spark UI, which can help. But Spark UI can be challenging to use, especially for the types of comparisons – over time, across jobs, and across a large, busy cluster – that you need to really optimize a job. And there is no “SQL UI” that specifically tells you how to optimize your SQL queries.
There are some general rules. For instance, a “bad” – inefficient – join can take hours. But it’s very hard to find where your app is spending its time, let alone whether a specific SQL command is taking a long time, and whether it can indeed be optimized.
Spark’s Catalyst optimizer, described here, does its best to optimize your queries for you. But when data sizes grow large enough, and processing gets complex enough, you have to help it along if you want your resource usage, costs, and runtimes to stay on the acceptable side.
Section 2: Cluster-Level Challenges
Cluster-level challenges are those that arise for a cluster that runs many (perhaps hundreds or thousands) of jobs, in cluster design (how to get the most out of a specific cluster), cluster distribution (how to create a set of clusters that best meets your needs), and allocation across on-premises resources and one or more public, private, or hybrid cloud resources.
The first step toward meeting cluster-level challenges is to meet job-level challenges effectively, as described above. A cluster that’s running unoptimized, poorly understood, slowdown-prone, and crash-prone jobs are impossible to optimize. But if your jobs are right-sized, cluster-level challenges become much easier to meet. (Note that Unravel Data, as mentioned in the previous section, helps you find your resource-heavy Spark jobs, and optimize those first. It also does much of the work of troubleshooting and optimization for you.)
Meeting cluster-level challenges for Spark may be a topic better suited for a graduate-level computer science seminar than for a blog post, but here are some of the issues that come up, and a few comments on each:
6. Are Nodes Matched Up to Servers or Cloud Instances?
A Spark node – a physical server or a cloud instance – will have an allocation of CPUs and physical memory. (The whole point of Spark is to run things in actual memory, so this is crucial.) You have to fit your executors and memory allocations into nodes that are carefully matched to existing resources, on-premises, or in the cloud. (You can allocate more or fewer Spark cores than there are available CPUs, but matching them makes things more predictable, uses resources better, and may make troubleshooting easier.)
On-premises, poor matching between nodes, physical servers, executors, and memory results in inefficiencies, but these may not be very visible; as long as the total physical resource is sufficient for the jobs running, there’s no obvious problem. However, issues like this can cause data centers to be very poorly utilized, meaning there’s big overspending going on – it’s just not noticed. (Ironically, the impending prospect of cloud migration may cause an organization to freeze on-prem spending, shining a spotlight on costs and efficiency.)
In the cloud, “pay as you go” pricing shines a different type of spotlight on efficient use of resources – inefficiency shows up in each month’s bill. You need to match nodes, cloud instances, and job CPU and memory allocations very closely indeed, or incur what might amount to massive overspending. This article gives you some guidelines for running Apache Spark cost-effectively on AWS EC2 instances and is worth a read even if you’re running on-premises, or on a different cloud provider.
You still have big problems here. In the cloud, with costs both visible and variable, cost allocation is a big issue. It’s hard to know who’s spending what, let alone what the business results that go with each unit of spending are. But tuning workloads against server resources and/or instances is the first step in gaining control of your spending, across all your data estates.
7. How Do I See What’s Going on in My Cluster?
“Spark is notoriously difficult to tune and maintain,” according to an article in The New Stack. Clusters need to be “expertly managed” to perform well, or all the good characteristics of Spark can come crashing down in a heap of frustration and high costs. (In people’s time and in business losses, as well as direct, hard dollar costs.)
Key Spark advantages include accessibility to a wide range of users and the ability to run in memory. But the most popular tool for Spark monitoring and management, Spark UI, doesn’t really help much at the cluster level. You can’t, for instance, easily tell which jobs consume the most resources over time. So it’s hard to know where to focus your optimization efforts. And Spark UI doesn’t support more advanced functionality – such as comparing the current job run to previous runs, issuing warnings, or making recommendations, for example.
Logs on cloud clusters are lost when a cluster is terminated, so problems that occur in short-running clusters can be that much harder to debug. More generally, managing log files is itself a big data management and data accessibility issue, making debugging and governance harder. This occurs in both on-premises and cloud environments. And, when workloads are moved to the cloud, you no longer have a fixed-cost data estate, nor the “tribal knowledge” accrued from years of running a gradually changing set of workloads on-premises. Instead, you have new technologies and pay-as-you-go billing. So cluster-level management, hard as it is, becomes critical.
8. Is my data partitioned correctly for my SQL queries? (and other inefficiencies)
Operators can get quite upset, and rightly so, over “bad” or “rogue” queries that can cost way more, in resources or cost, than they need to. One colleague describes a team he worked on that went through more than $100,000 of cloud costs in a weekend of crash-testing a new application – a discovery made after the fact. (But before the job was put into production, where it would have really run up some bills.)
SQL is not designed to tell you how much a query is likely to cost, and more elegant-looking SQL queries (ie, fewer statements) may well be more expensive. The same is true of all kinds of code you have running.
So you have to do some or all of three things:
- Learn something about SQL, and about coding languages you use, especially how they work at runtime
- Understand how to optimize your code and partition your data for good price/performance
- Experiment with your app to understand where the resource use/cost “hot spots” are, and reduce them where possible
All this fits in the “optimize” recommendations from 1. and 2. above. We’ll talk more about how to carry out optimization in Part 2 of this blog post series.
9. When do I take advantage of auto-scaling?
The ability to auto-scale – to assign resources to a job just while it’s running, or to increase resources smoothly to meet processing peaks – is one of the most enticing features of the cloud. It’s also one of the most dangerous; there is no practical limit to how much you can spend. You need some form of guardrails, and some form of alerting, to remove the risk of truly gigantic bills.
The need for auto-scaling might, for instance, determine whether you move a given workload to the cloud, or leave it running, unchanged, in your on-premises data center. But to help an application benefit from auto-scaling, you have to profile it, then cause resources to be allocated and de-allocated to match the peaks and valleys. And you have some calculations to make because cloud providers charge you more for spot resources – those you grab and let go of, as needed – than for persistent resources that you keep running for a long time. Spot resources may cost two or three times as much as dedicated ones.
The first step, as you might have guessed, is to optimize your application, as in the previous sections. Auto-scaling is a price/performance optimization, and a potentially resource-intensive one. You should do other optimizations first.
Then profile your optimized application. You need to calculate ongoing and peak memory and processor usage, figure out how long you need each, and the resource needs and cost for each state. And then decide whether it’s worth auto-scaling the job, whenever it runs, and how to do that. You may also need to find quiet times on a cluster to run some jobs, so the job’s peaks don’t overwhelm the cluster’s resources.
To help, Databricks has two types of clusters, and the second type works well with auto-scaling. Most jobs start out in an interactive cluster, which is like an on-premises cluster; multiple people use a set of shared resources. It is, by definition, very difficult to avoid seriously underusing the capacity of an interactive cluster.
So you are meant to move each of your repeated, resource-intensive, and well-understood jobs off to its own, dedicated, job-specific cluster. A job-specific cluster spins up, runs its job, and spins down. This is a form of auto-scaling already, and you can also scale the cluster’s resources to match job peaks, if appropriate. But note that you want your application profiled and optimized before moving it to a job-specific cluster.
10. How Do I Find and Fix Problems?
Just as it’s hard to fix an individual Spark job, there’s no easy way to know where to look for problems across a Spark cluster. And once you do find a problem, there’s very little guidance on how to fix it. Is the problem with the job itself, or the environment it’s running in? For instance, over-allocating memory or CPUs for some Spark jobs can starve others. In the cloud, the noisy neighbors problem can slow down a Spark job run to the extent that it causes business problems on one outing – but leaves the same job to finish in good time on the next run.
The better you handle the other challenges listed in this blog post, the fewer problems you’ll have, but it’s still very hard to know how to most productively spend Spark operations time. For instance, a slow Spark job on one run may be worth fixing in its own right and may be warning you of crashes on future runs. But it’s very hard just to see what the trend is for a Spark job in performance, let alone to get some idea of what the job is accomplishing vs. its resource use and average time to complete. So Spark troubleshooting ends up being reactive, with all too many furry, blind little heads popping up for operators to play Whack-a-Mole with.
Impacts of these Challenges
If you meet the above challenges effectively, you’ll use your resources efficiently and cost-effectively. However, our observation here at Unravel Data is that most Spark clusters are not run efficiently.
What we tend to see most are the following problems – at a job level, within a cluster, or across all clusters:
- Under-allocation. It can be tricky to allocate your resources efficiently on your cluster, partition your datasets effectively, and determine the right level of resources for each job. If you under-allocate (either for a job’s driver or the executors), a job is likely to run too slowly or crash. As a result, many developers and operators resort to…
- Over-allocation. If you assign too many resources to your job, you’re wasting resources (on-premises) or money (cloud). We hear about jobs that need, for example, 2GB of memory but are allocated much more – in one case, 85GB.
Applications can run slowly, because they’re under-allocated – or because some apps are over-allocated, causing others to run slowly. Data teams then spend much of their time fire-fighting issues that may come and go, depending on the particular combination of jobs running that day. With every level of resource in shortage, new, business-critical apps are held up, so the cash needed to invest against these problems doesn’t show up. IT becomes an organizational headache, rather than a source of business capability.
Conclusion
To jump ahead to the end of this series a bit, our customers here at Unravel are easily able to spot and fix over-allocation and inefficiencies. They can then monitor their jobs in production, finding and fixing issues as they arise. Developers even get on board, checking their jobs before moving them to production, then teaming up with Operations to keep them tuned and humming.
One Unravel customer, Mastercard, has been able to reduce usage of their clusters by roughly half, even as data sizes and application density has moved steadily upward during the global pandemic. And everyone gets along better, and has more fun at work, while achieving these previously unimagined results.
So, whether you choose to use Unravel or not, develop a culture of right-sizing and efficiency in your work with Spark. It will seem to be a hassle at first, but your team will become much stronger, and you’ll enjoy your work life more, as a result.
You need a sort of X-ray of your Spark jobs, better cluster-level monitoring, environment information, and to correlate all of these sources into recommendations. In Troubleshooting Spark Applications, Part 2: Solutions, we will describe the most widely used tools for Spark troubleshooting – including the Spark Web UI and our own offering, Unravel Data – and how to assemble and correlate the information you need.