


“Data is the new oil, and analytics is the combustion engine.” – Peter Sondergaard
Cloud data analytics is the key to maximizing value from your data. The lakehouse has emerged as a flexible and efficient architecture, and Databricks has emerged as a popular choice. However, data lakehouse processing volumes can fluctuate, leading to unpredictable surges in cloud data spending that impact budgeting and profitability. Executives want to make sure they are getting the most from their lakehouse investments and not overspending.
Implementing a proactive data observability and FinOps approach early in your lakehouse journey helps ensure you achieve your business objectives and bring predictability to your financial planning. Choosing the right lakehouse observability and FinOps tool sets your team up for success. Since the goal is efficiency, starting with free tools makes sense. Two free options stand out:
- Overwatch – the open source Databricks observability tool
- Unravel Standard – the free version of Unravel’s data observability and FinOps platform
Below are 5 reasons to choose Unravel free observability vs. Databricks free observability:
Reason #1: Complete observability
Many organizations take a do-it-yourself approach, building piecemeal observability solutions in-house by cobbling together a variety of data sources using open source tools. The problem is that it takes months or even years to get something usable up and running. Unravel’s data observability and FinOps platform helps you get results fast.
Unravel provides a 360° out-of-the-box solution
Unravel provides a holistic view of your Databricks estate, reducing the time to value. Gain deep insights into cluster performance, job execution, resource utilization, and cost drivers through comprehensive lakehouse observability. Unravel’s observability solution provides you with detailed visibility into the performance of your Databricks clusters.
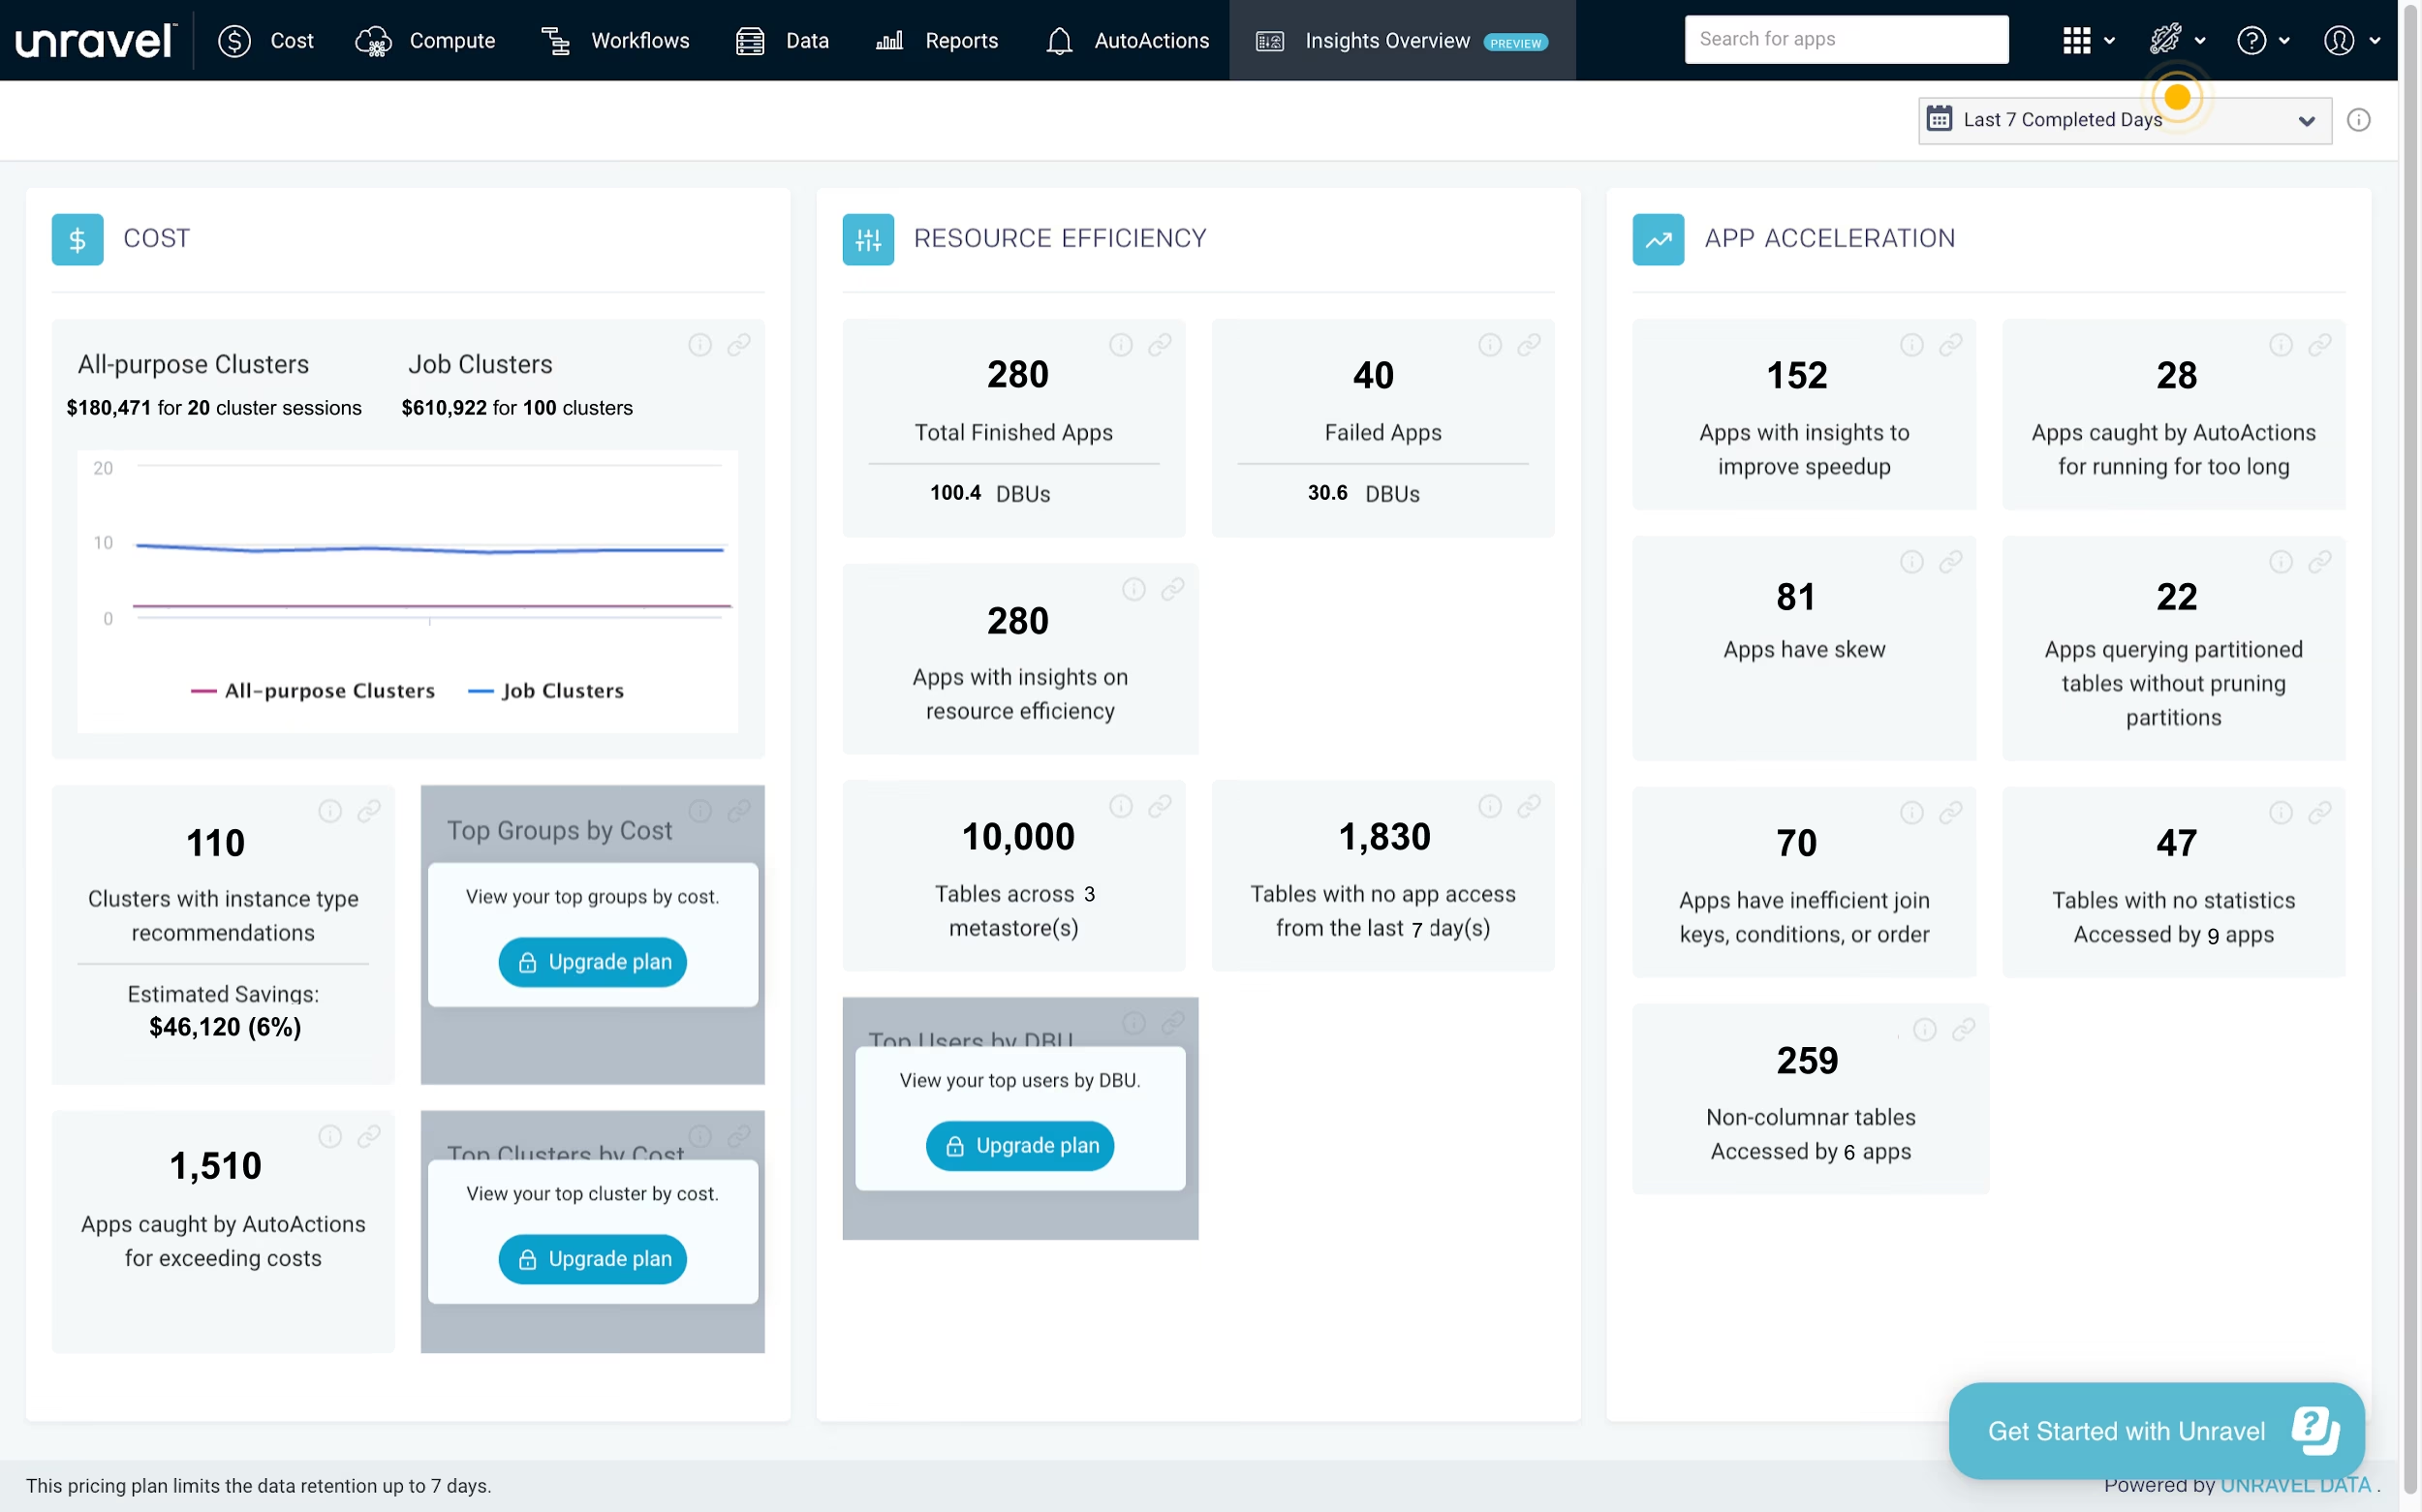
Insights overview dashboard in Unravel Standard
Ensure no blind spots in your analysis by leveraging Unravel’s end-to-end visibility across all aspects of your Databricks environment. View your lakehouse landscape at a glance with the Insights Overview dashboard. You can see the overall health of your Databricks estate, including the number of clusters that are over- or under-provisioned, the total number of inefficient and failed apps, and other summary statistics to guide your efforts to optimize your lakehouse towards better performance and cost efficiency.
Purpose-built correlation
Unravel’s purpose-built correlation models help you identify inefficient jobs at code, data layout/partitioning, and infrastructure levels. Databricks logs, metrics, events, traces, and source code are automatically evaluated to simplify root cause analysis and issue resolution. You can dive deep into the execution details of your Databricks jobs, track the progress of each job, and see resource usage details. This helps you identify long-running and resource-intensive jobs that might be impacting the overall performance and efficiency of your lakehouse estate.
End-to-end visibility
Visual summaries provide a way to look across all the jobs and clusters in your Databricks workspace. No need to click around your Databricks workspace looking for issues, run queries, or pull details into a spreadsheet to summarize results. Unravel helps you easily see all the details in one place.
Reason #2: Real-time visibility
A single errant job or underutilized cluster can derail your efficiency goals and delay critical data pipelines. The ability to see job and cluster performance and efficiency in real time provides an early warning system.
Live updates for running jobs and clusters
React promptly to any anomalies or bottlenecks in your clusters and jobs to ensure efficiency. Unravel’s real-time insights allow you to catch long-running jobs before they impact pipeline performance or consume unnecessary resources.
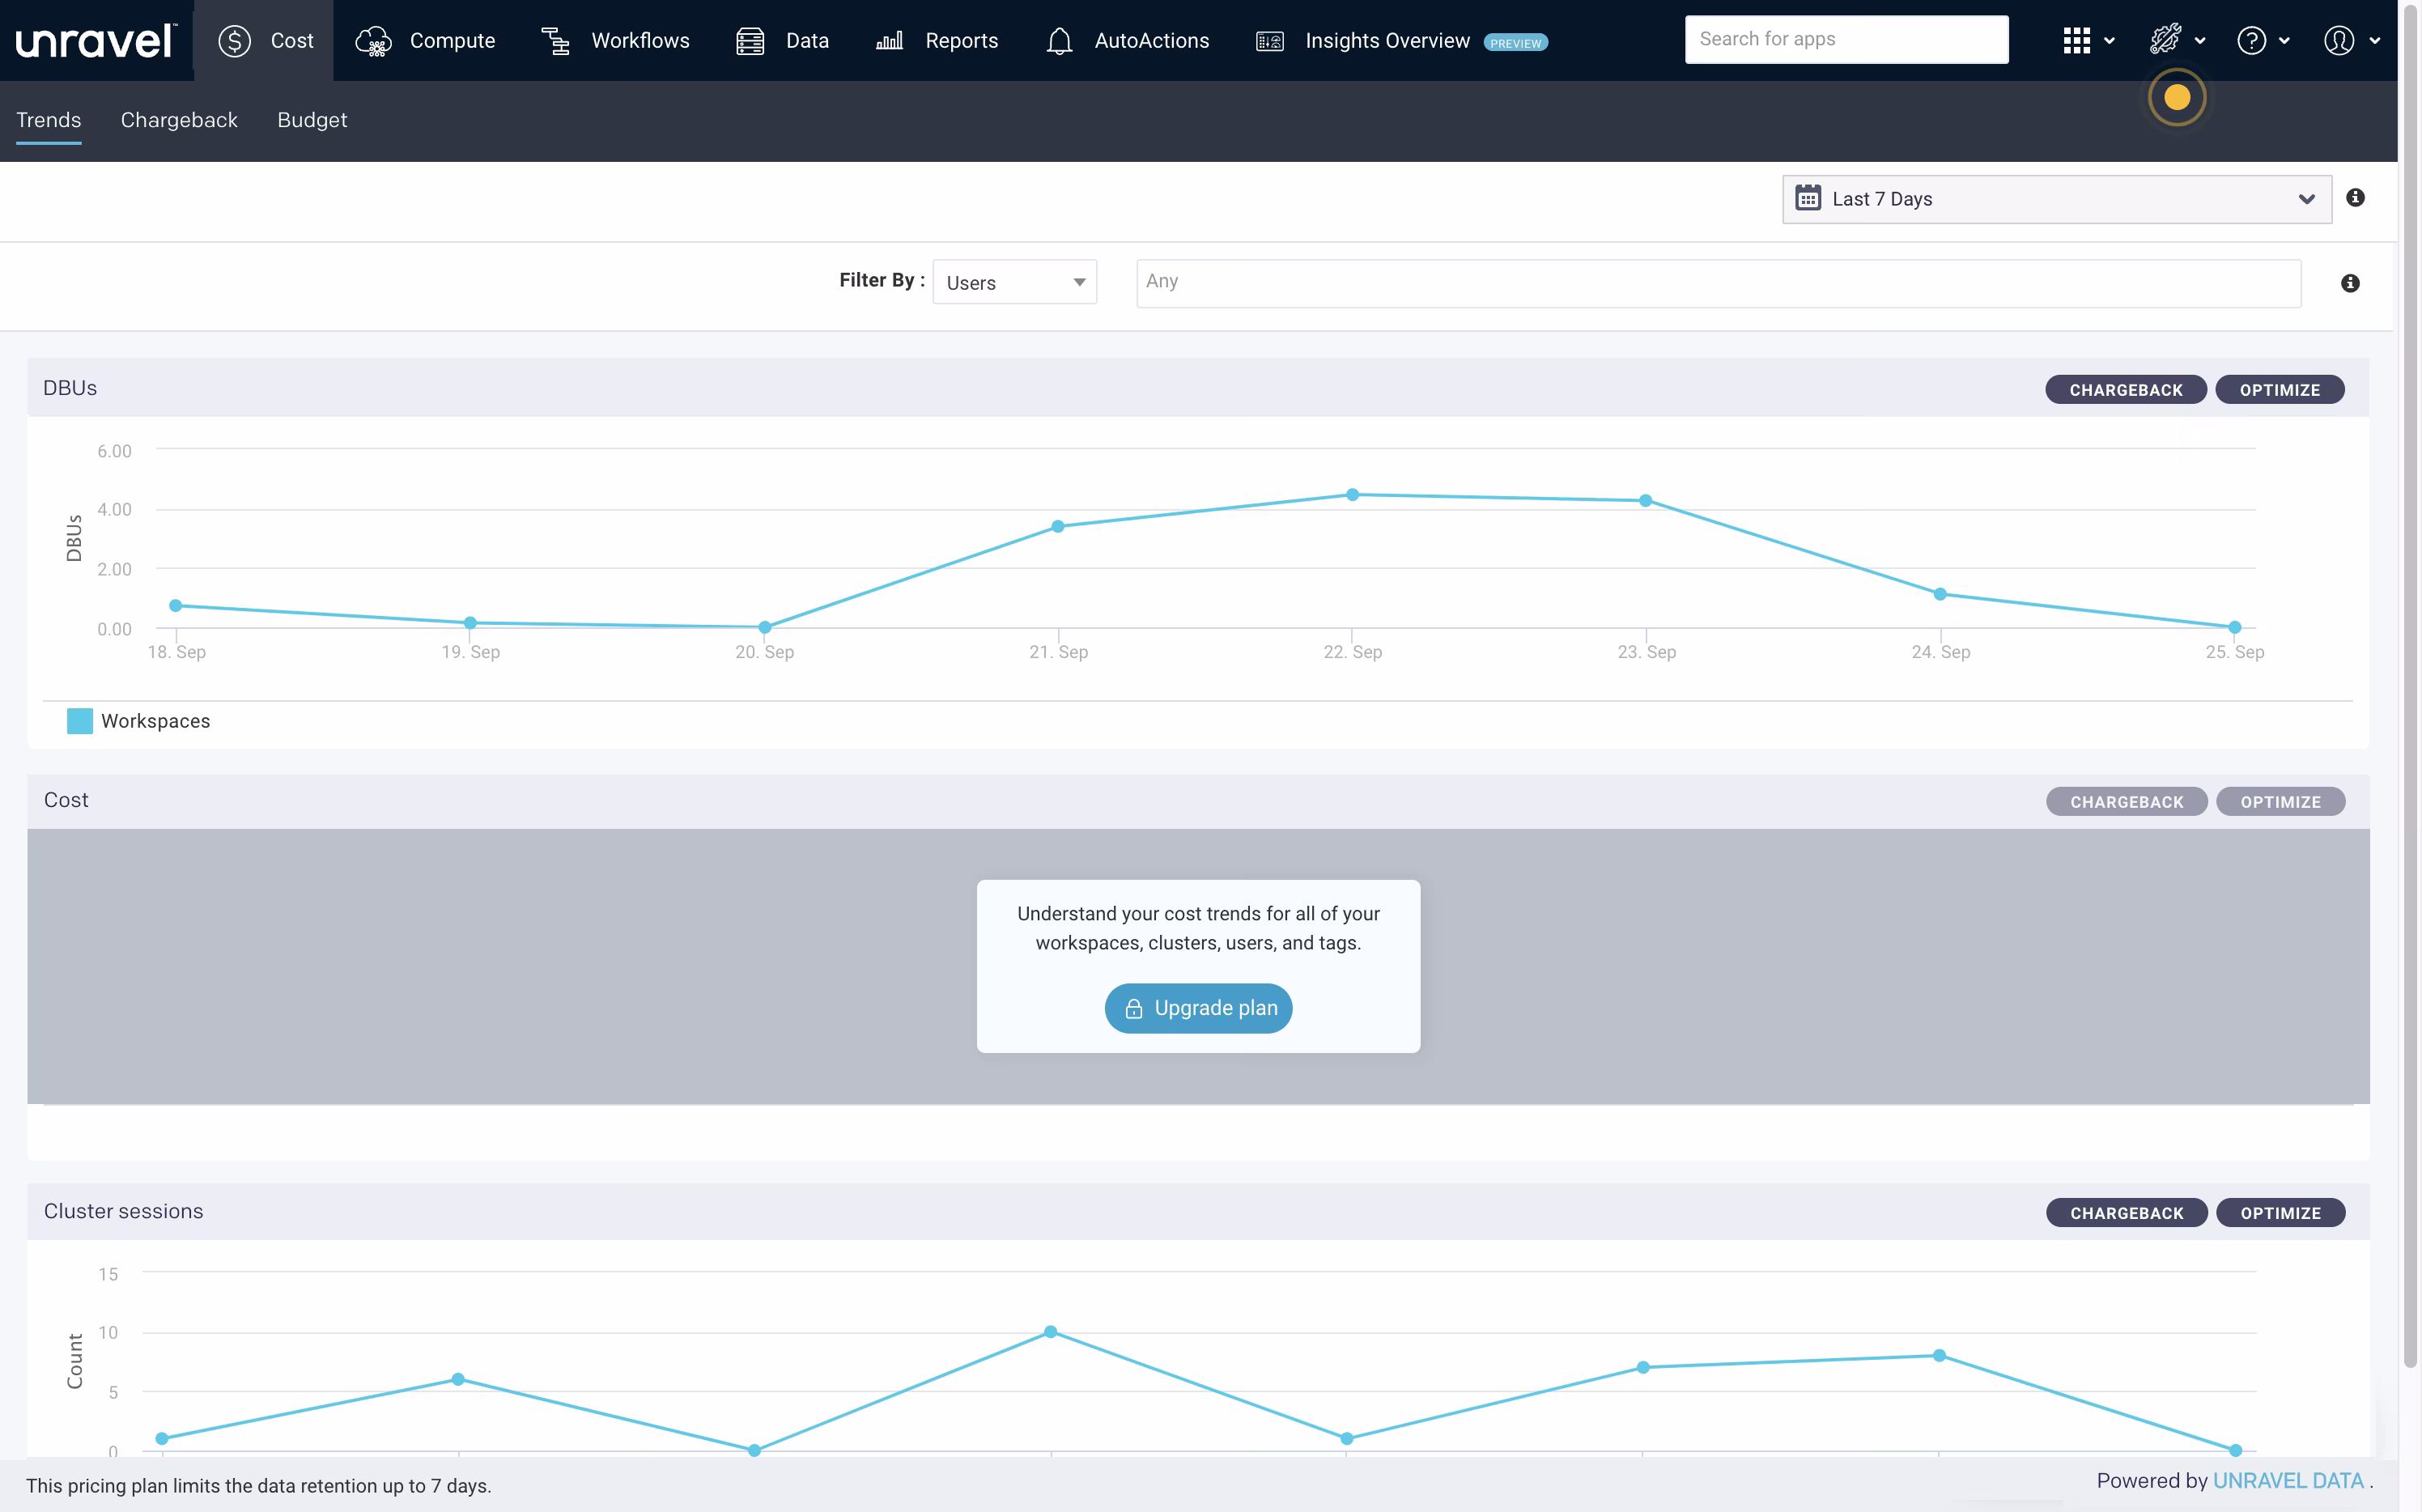
Workspace Trends dashboard in Unravel Standard
See DBU usage and cluster session trends
By understanding the real-time performance of your Databricks workloads, you can identify areas where improvements can be made to improve efficiency without sacrificing performance. Leverage Unravel’s real-time insights to make data-driven decisions for better resource allocation and workload management.
Drill down to see DBU usage and tasks for a specific day
Quickly find resource consumption outliers by day to understand how usage patterns are driving costs. Unravel helps you identify opportunities to reduce waste and increase cluster utilization. By having visibility into the real-time cost implications of your jobs and clusters, you can make faster decisions to boost performance and improve business results.
User-level reporting for showback/chargeback
Granular reporting to the user and job level helps you produce accurate and timely showback and chargeback reports. With Unravel’s real-time visibility into your Databricks workloads, you have the power to see which teams are consuming the most resources and proactively manage costs to achieve efficient operations. Reacting quickly to anomalies and leveraging real-time, user-level insights enables better decision-making for resource allocation and utilization. Unravel enables central data platform and operations teams to provide a reliable, single source of truth for showback and chargeback reporting.